Now that ORDS 21.3.0 is available in all Oracle Autonomous Database regions there are even more options for copying data to, from and within Oracle Cloud. This release contains two important enhancements to the RESTful Data Pump services provided by the ORDS Database API
- Any REST Enabled database account can access the Data Pump services. Of course, the database account in question still needs to have the necessary permissions in the database to perform the actions but before this release, only administrators could access the Database API Data Pump services.
- Use Oracle Cloud Object Storage for export / import file destination / source. The databases must support the interaction with Object Storage though DBMS_CLOUD package. This is available out of the box with Oracle Autonomous Database.
Options? I got plenty
With these new capabilities, particularly with the Object Storage integration, moving to a hosted Oracle Autonomous Database is even easier. Not only that, moving data between existing Autonomous Databases is now easier too. To demonstrate, this article provides a step by step walk through of copying tables from a 19c Autonomous Database to a 21c Autonomous Database.
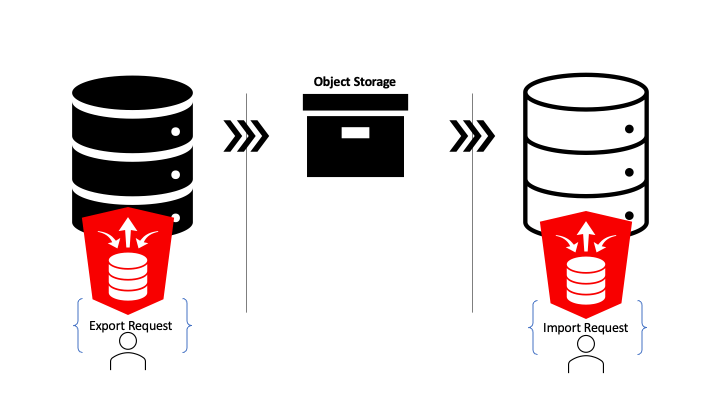
One request to export and one request to import!
Copying data between Autonomous Databases made easy
Just to reiterate the demonstration scenario: non-administrator database users will copy tables and data from hosted 19c database to a hosted 21c database with hosted object storage as the intermediary. That’s achieved through one ORDS Database API Data Pump request to export and one ORDS Database API Data Pump request to import.

Prepare to win!
To make this all happen so easily does require a little preparation of key components. Here’s what is required…
- Two Autonomous databases. For this demonstration they are in the same region, but the Object Storage bucket could be configured to replicate to another region.
- Object Storage bucket. A private bucket for file storage in your Oracle Cloud tenancy. The databases will have access to the bucket but will require credentials to do so.
- Authorisation Token. These are revokable credentials that will be used by both the source and target databases to connect to the Object Storage bucket.
- Database Account. In both databases a REST Enabled database user is required. It is these user credentials that will be used to make the REST request to ORDS. Also, it is these database users that will be performing the DBMS_DATAPUMP procedure calls. Therefore they will require certain privileges in the database. If they are not Administrator users they must have these privileges granted to them. More on that later.
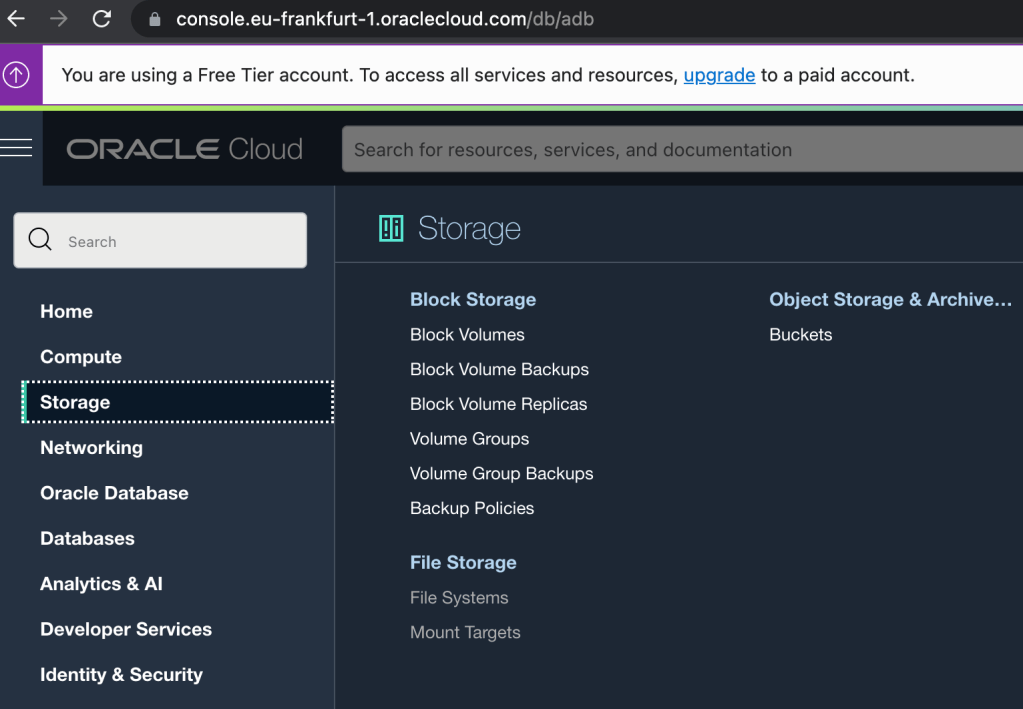
Note that all of the above: Database, Object Storage and ORDS, are available with the Free Tier account on Oracle Cloud Infrastructure.
Autonomous Databases
For this demonstration there are two Always Free databases in the Frankfurt region. The one named DB 201912101106 database is an Oracle 19c Enterprise Edition database. The one named DB 202109201918 is a the 21c database.

Object Storage Bucket
To keep files for this demonstration separate there is a dedicated Object Storage bucket which can be deleted afterwards. There’s plenty of space available in the Free Tier and the bucket is private but it is a good practice not leave exported data files around long.
The bucket could be called anything but for simplicity in this demonstration it is named: DataPumpBucket
Auth Token
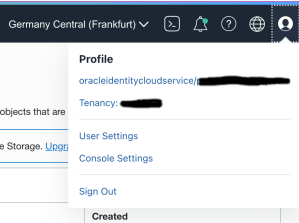
So that the databases can interact with the private Object Storage bucket they need authentication credentials. This is achieved through creating an Auth Token and storing it as a credential in the databases. Tokens are created for a specific Oracle Cloud user and are managed in the User Settings section for the user. The quickest way there is to select User Settings from the profile menu option in the top right corner.
Once in the User Settings section select the Auth Tokens resources tab and click on the Generate Token button. In the popup dialog enter a name for the token. This name can be anything that helps describe the purpose of the token and makes it easier to identify the token later for deleting it if necessary. What really matters is the generated token value because that is effectively the secret password that will be stored in both the source and target databases. After entering a name, in this case it was DataPumpToken, press the Generate Token button to produce a token value. The value is hidden by default. Copy that value as it will not be retrievable once the dialog box is closed. That token value will be used latter when creating Database Credentials in both databases.
Database Account – Source and Target Schemas
The source schema will have tables with data that will be exported to the Object Storage bucket. That user must be created, granted the necessary privileges, REST Enabled, and have the tables created too. With the exception of creating tables, the same actions will be taken for the database account in the target database. In both cases the schema/user will be called DBTST. In the source database, the 19c one, the ADMIN user can create a REST Enabled user through Database Actions.

The same can be done by the ADMIN user in the 21c target database. Once created these users can invoke the Data Pump services in ORDS Database API but won’t achieve much as they do not have the necessary privileges. In both databases the ADMIN user must run the following to grant these privileges.
-- REQUIRED FOR DATA PUMP TO OBJECT STORAGE
GRANT EXECUTE ON DBMS_CLOUD TO DBTST;

-- REQUIRED FOR DATA PUMP LOGS
GRANT READ, WRITE on DIRECTORY DATA_PUMP_DIR to DBTST;

-- THESE EXPLICIT GRANTS ARE REQUIRED FOR DATA PUMP
GRANT CREATE ROLE TO DBTST ;
GRANT CREATE VIEW TO DBTST ;
GRANT CREATE SESSION TO DBTST ;
GRANT CREATE TABLE TO DBTST ;
GRANT CREATE SEQUENCE TO DBTST ;
GRANT UNLIMITED TABLESPACE TO DBTST ;
GRANT CREATE PROCEDURE TO DBTST ;
Note that the above is not necessary for users with the DBA role as those users will have these privileges already.
Database Credentials
Now we get into defining the credentials that both source and target database accounts will use. Although Data Pump can work with global credentials the ORDS Database API currently restricts the use of credentials to just those that the user has defined themselves. In other words, the credential must found by name in USER_CREDENTIALS view and ENABLED. Login to both the source and target database accounts and run this command, using the token value copied from the Auth Token step and the corresponding username…
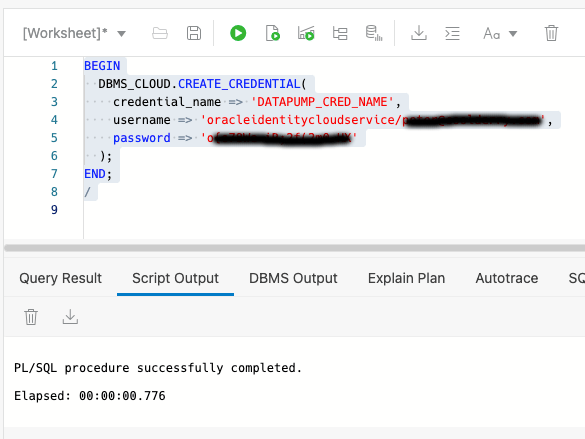
In the above example the credential name given is DATAPUMP_CRED_NAME. It could be called anything. Whatever name is given, this is the name that is used in the request payload to initiate an export or import job later.
Source Tables
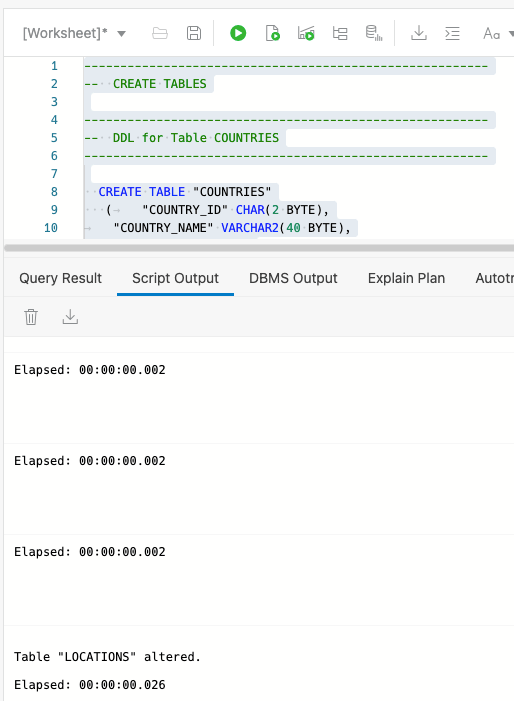
The purpose of this exercise is to show data being copied from one source ( 19c Autonomous Database ) to another ( 21c Autonomous Database ) so let’s create some tables and put some data in them. For the source database account run this dpexp_setup.sql script.
Setup a REST client
Any client for sending HTTP requests will do and curl is a common command line utility that is used in many examples. Although ubiquitous curl does have a few drawbacks for REST calls. In particular that it does not format the response structure well. In this demonstration we’ll use the Postman app to make the requests. For convenience we will import the OpenAPI document that is generated by ORDS. The URL for the openapi.json document will be different for both the source and target REST Enabled schemas and we can take advantage of that to have separate API collections.
To get started, import the API document for the source schema and set the Basic Authentication credentials that will be inherited by all the requests in the collection. Rename the collection to make it clearer what it is for.
Make your move
Now it’s time to do what we came here for…
- Export from the source Autonomous Database
- See the files in Object Storage
- Import to the target Autonomous Database
- See the data in the new tables
Export
For this demonstration we’ll export all tables, except for JOB_HISTORY, in the DBTST schema to the bucket called DataPumpBucket. The URL for bucket and the Data Pump filename pattern will be used. You can derive the URL from the OCI console Bucket details page which ends with /DataPumpBucket/objects. Replace the https://console. prefix with https://objectstorage. Then replace the DataPumpBucket/objects suffix with DataPumpBucket/o/ and then add the filename pattern. In this case we’ll go with EXPDAT%U-DBTST.DMP. Oracle Data Pump will create numbered files with that pattern in the bucket.
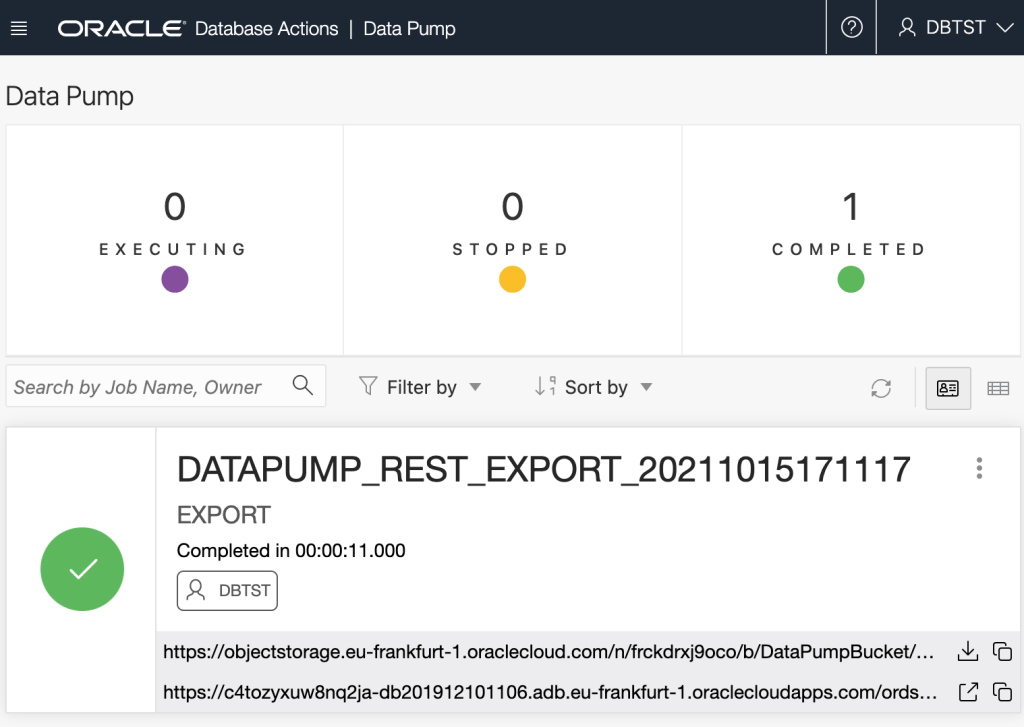
Now that the Data Pump Job is created its status and log can be retrieved. It’s easy to create a new REST request in Postman just by clicking on the link in the response body. Save the request definition so that the previously defined Basic Authentication can be inherited.
Review Object Storage
Refresh the bucket details page to see that Oracle Data Pump has created files there.

Import
Now for getting the data imported to the target database. As before, the Postman app has the Database API document imported as a collection so that the URL and basic authorisation details are defined in one place. Using the Database API we can confirm that this DBTST schema does not have any tables.
Next, submit the import request. The credential_name and file_name parameters are the same as the export but operation parameter value should now be IMPORT.

Now review the Data Pump import job status and confirm that the tables have been created.
Now that the tables are there, Database Actions can be used to confirm they have data too.
Conclusion
What has been demonstrated here is just one of the many options now available getting data to, from or between Autonomous Databases. There were a few perquisite steps but once they are in place, exporting and importing can be repeated with just one request each.
Although an on-premise database may not have the DBMS_CLOUD integration for accessing Oracle Cloud Object Storage, the ability for non-administrator users to import and export to their database directory is now available through ORDS Database API.
The demonstration showed exporting and importing tables but don’t forget that through the ORDS Database API Data Pump services you can do much more. Export the full databases, remap a schema on import, and much more. Over to you to take this further in your environment.