In previous posts I’ve covered Load Balancing ORDS with NGINX and ORDS Access Logs in Kibana topics which sets things up nicely for the next logic topic: identifying which ORDS instance the load balancer routed a particular request to.
Separate access logs for each instance
In ORDS Access Logs in Kibana I used filebeat apache module to watch access logs that will have entries in an apache log format. The modules.d/apache.yml file was edited to look for files in a particular location. For this exercise we’ll have 3 ORDS instances writing their access logs to separate files. Since this is a temporary environment, I’ll write to the /tmp/ directory. You will want to use a different directory for a more permanent setup.
modules.d/apache.yml
# Module: apache
# Docs: https://www.elastic.co/guide/en/beats/filebeat/7.13/filebeat-module-apache.html

- module: apache
  # Access logs
  access:
    enabled: true

    # Set custom paths for the log files. If left empty,
    # Filebeat will choose the paths depending on your OS.
    var.paths: ["/tmp/ords-access*.log"]

  # Error logs
  error:
    enabled: false

    # Set custom paths for the log files. If left empty,
    # Filebeat will choose the paths depending on your OS.
    #var.paths:
Separate configuration files

There will be 3 separate ORDS instances running in standalone mode on the same machine all listening on different ports and writing their access logs to different files.
- Port 9085 => /tmp/ords-access-01.log
- Port 9090 => /tmp/ords-access-02.log
- Port 9095 => /tmp/ords-access-03.log
The nginx load balancer will listen on port 8080 and round robin route to the three separate ports.
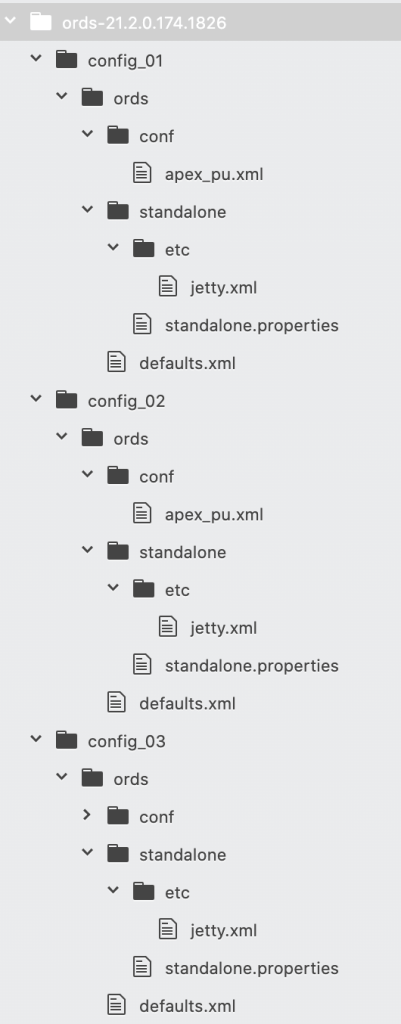
I have extracted ORDS 21.2.0 distribution zip file to /scratch/ords-21.2.0.174.1826/ and created three distinct configuration directories under that: config_01, config_02, config_03. They all have the same ords/defaults.xml and ords/conf/apex_pu.xml. These files define how to connect to the database.
However, the standalone/standalone.properties specifies a different port and the standalone/etc/jetty.xml specifies a different log location.
Example configuration: config_01
# config_01
# ords/standalone/standalone.properties
jetty.port=9085
standalone.context.path=/ords
<?xml version="1.0"?>
<!DOCTYPE Configure PUBLIC "-//Jetty//Configure//EN" "http://www.eclipse.org/jetty/configure.dtd">
<Configure id="Server" class="org.eclipse.jetty.server.Server">
    <Ref id="Handlers">
      <Call name="addHandler">
        <Arg>
          <New id="RequestLog" class="org.eclipse.jetty.server.handler.RequestLogHandler">
            <Set name="requestLog">
              <New id="RequestLogImpl" class="org.eclipse.jetty.server.CustomRequestLog">
                <Arg>/tmp/ords-access-01.log</Arg>
                <Arg>%{remote}a - %u %t "%r" %s %O "%{Referer}i" "%{User-Agent}i"</Arg>
              </New>
            </Set>
          </New>
        </Arg>
      </Call>
    </Ref>
</Configure>
Repeat the configuration for config_02 and config_3 but change the jetty.port and the access log filename.
Start up the services
The same ords.war will be used with each instance, taking advantage of the -Dconfig.dir=/path/to/config/ startup option. Let’s do this in separate terminal windows.
java -Dconfig.dir=/scratch/ords-21.2.0.174.1826/config_01 -jar /scratch/ords-21.2.0.174.1826/ords.war standalone
java -Dconfig.dir=/scratch/ords-21.2.0.174.1826/config_02 -jar /scratch/ords-21.2.0.174.1826/ords.war standalone
java -Dconfig.dir=/scratch/ords-21.2.0.174.1826/config_03 -jar /scratch/ords-21.2.0.174.1826/ords.war standalone
When they complete the startup process you should see something like this in each terminal window:
2021-08-06T09:27:10.516Z INFO        Oracle REST Data Services initialized
Oracle REST Data Services version : 21.2.0.r1741826
Oracle REST Data Services server info: jetty/9.4.42.v20210604
The nginx.conf will specify the 3 servers to route to. Since I’m running nginx in a docker container, I’ll have to refer to host.docker.internal as the hostname.
events {}
http {
    upstream ords {
        server host.docker.internal:9085;
        server host.docker.internal:9090;
        server host.docker.internal:9095;
    }

    server {
        location / {
            proxy_pass http://ords;
            proxy_set_header Host $host;
        }
    }
}
Refer back to Load Balancing ORDS with NGINX for more information on this configuration. Once the nginx.conf change is made, startup the load balancer.
docker run -p 8080:80 -v ${PWD}/nginx.conf:/etc/nginx/nginx.conf:ro -d nginx
In my case I’ll use curl to access an ORDS service already defined in the database: curl http://localhost:8080/ords/pdbadmin/api/hello and can see an entry in one of the /tmp/ords-access-*.log files.
Review the logs
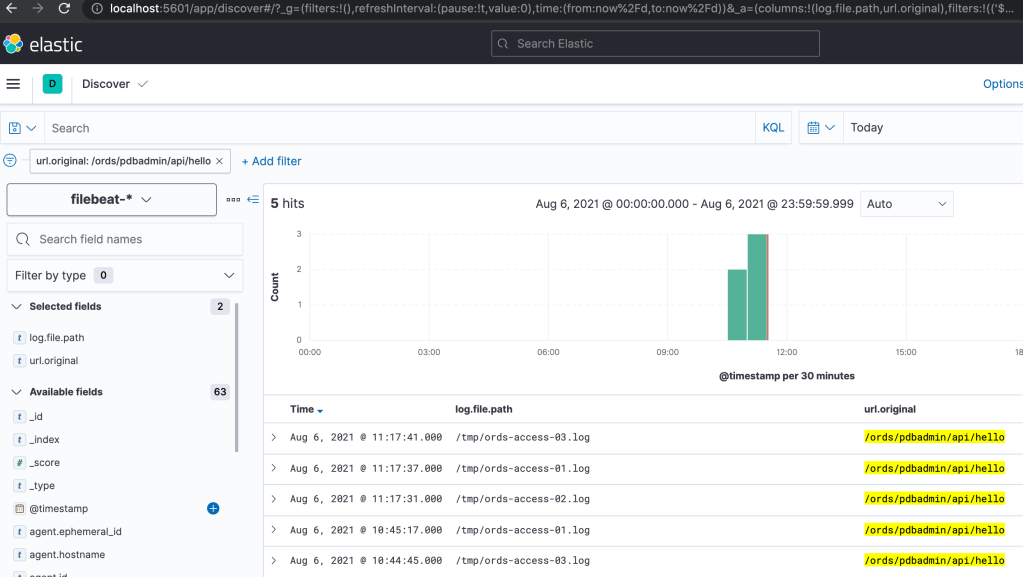
Follow the steps in ORDS Access Logs in Kibana for starting up Elasticsearch, Kibana and Filebeat. Once that’s all started, use your browser to access http://localhost:5601/ and navigate to Analytics/Discover to see all the log entries from all three access logs.
Using curl again, I have made some further requests to the ORDS REST service at http://localhost:8080/ords/pdbadmin/api/hello and can see that the requests are distributed across the three ORDS standalone instances.

Summary
There are a number of processes running at this stage but one now has a visual representation of the access logs for each ORDS instances. To recap…
- Three ORDS standalone instances listening on separate ports and recording access logs to separate files
- NGINX Load Balancer listing on port 8080 and routing to all three ORDS instances using the default round robin policy
- Elasticsearch is providing a datastore for log entries
- Filebeat monitors the log files and pushes changes to Elasticsearch. It expects the file entries to be in an apache log format
- Kibana provides browser based access to the data in Elasticsearch and has been configured with a Filebeat index pattern definition to make discovering log entries easier
With all this in place, one can see which ORDS instance processed a particular request.