Where did that request go?

In previous posts I’ve covered Load Balancing ORDS with NGINX and ORDS Access Logs in Kibana topics which sets things up nicely for the next logic topic: identifying which ORDS instance the load balancer routed a particular request to.

Separate access logs for each instance

In ORDS Access Logs in Kibana I used filebeat apache module to watch access logs that will have entries in an apache log format. The modules.d/apache.yml file was edited to look for files in a particular location. For this exercise we’ll have 3 ORDS instances writing their access logs to separate files. Since this is a temporary environment, I’ll write to the /tmp/ directory. You will want to use a different directory for a more permanent setup.

modules.d/apache.yml

# Module: apache
# Docs: https://www.elastic.co/guide/en/beats/filebeat/7.13/filebeat-module-apache.html

- module: apache
  # Access logs
  access:
    enabled: true

    # Set custom paths for the log files. If left empty,
    # Filebeat will choose the paths depending on your OS.
    var.paths: ["/tmp/ords-access*.log"]

  # Error logs
  error:
    enabled: false

    # Set custom paths for the log files. If left empty,
    # Filebeat will choose the paths depending on your OS.
    #var.paths:

Separate configuration files

Configuration directory structure

There will be 3 separate ORDS instances running in standalone mode on the same machine all listening on different ports and writing their access logs to different files.

  • Port 9085 => /tmp/ords-access-01.log
  • Port 9090 => /tmp/ords-access-02.log
  • Port 9095 => /tmp/ords-access-03.log

The nginx load balancer will listen on port 8080 and round robin route to the three separate ports.

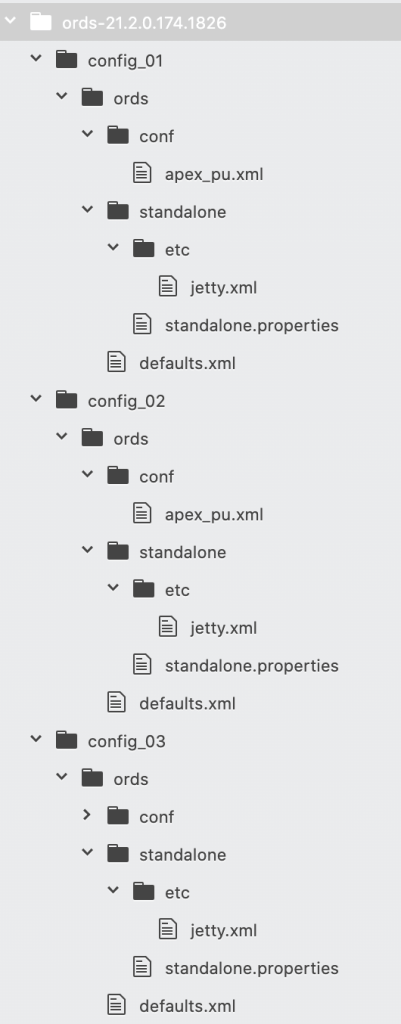
I have extracted ORDS 21.2.0 distribution zip file to /scratch/ords-21.2.0.174.1826/ and created three distinct configuration directories under that: config_01, config_02, config_03. They all have the same ords/defaults.xml and ords/conf/apex_pu.xml. These files define how to connect to the database.

However, the standalone/standalone.properties specifies a different port and the standalone/etc/jetty.xml specifies a different log location.

Example configuration: config_01

# config_01
# ords/standalone/standalone.properties
jetty.port=9085
standalone.context.path=/ords

<?xml version="1.0"?>
<!DOCTYPE Configure PUBLIC "-//Jetty//Configure//EN" "http://www.eclipse.org/jetty/configure.dtd">
<Configure id="Server" class="org.eclipse.jetty.server.Server">
    <Ref id="Handlers">
      <Call name="addHandler">
        <Arg>
          <New id="RequestLog" class="org.eclipse.jetty.server.handler.RequestLogHandler">
            <Set name="requestLog">
              <New id="RequestLogImpl" class="org.eclipse.jetty.server.CustomRequestLog">
                <Arg>/tmp/ords-access-01.log</Arg>
                <Arg>%{remote}a - %u %t "%r" %s %O "%{Referer}i" "%{User-Agent}i"</Arg>
              </New>
            </Set>
          </New>
        </Arg>
      </Call>
    </Ref>
</Configure>

Repeat the configuration for config_02 and config_3 but change the jetty.port and the access log filename.

Start up the services

The same ords.war will be used with each instance, taking advantage of the -Dconfig.dir=/path/to/config/ startup option. Let’s do this in separate terminal windows.

java -Dconfig.dir=/scratch/ords-21.2.0.174.1826/config_01 -jar /scratch/ords-21.2.0.174.1826/ords.war standalone
java -Dconfig.dir=/scratch/ords-21.2.0.174.1826/config_02 -jar /scratch/ords-21.2.0.174.1826/ords.war standalone
java -Dconfig.dir=/scratch/ords-21.2.0.174.1826/config_03 -jar /scratch/ords-21.2.0.174.1826/ords.war standalone

When they complete the startup process you should see something like this in each terminal window:

2021-08-06T09:27:10.516Z INFO        Oracle REST Data Services initialized
Oracle REST Data Services version : 21.2.0.r1741826
Oracle REST Data Services server info: jetty/9.4.42.v20210604

The nginx.conf will specify the 3 servers to route to. Since I’m running nginx in a docker container, I’ll have to refer to host.docker.internal as the hostname.

events {}
http {
    upstream ords {
        server host.docker.internal:9085;
        server host.docker.internal:9090;
        server host.docker.internal:9095;
    }

    server {
        location / {
            proxy_pass http://ords;
            proxy_set_header Host $host;
        }
    }
}

Refer back to Load Balancing ORDS with NGINX for more information on this configuration. Once the nginx.conf change is made, startup the load balancer.

docker run -p 8080:80 -v ${PWD}/nginx.conf:/etc/nginx/nginx.conf:ro -d nginx

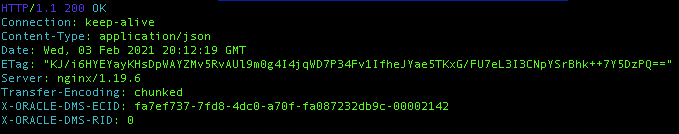
In my case I’ll use curl to access an ORDS service already defined in the database: curl http://localhost:8080/ords/pdbadmin/api/hello and can see an entry in one of the /tmp/ords-access-*.log files.

Review the logs

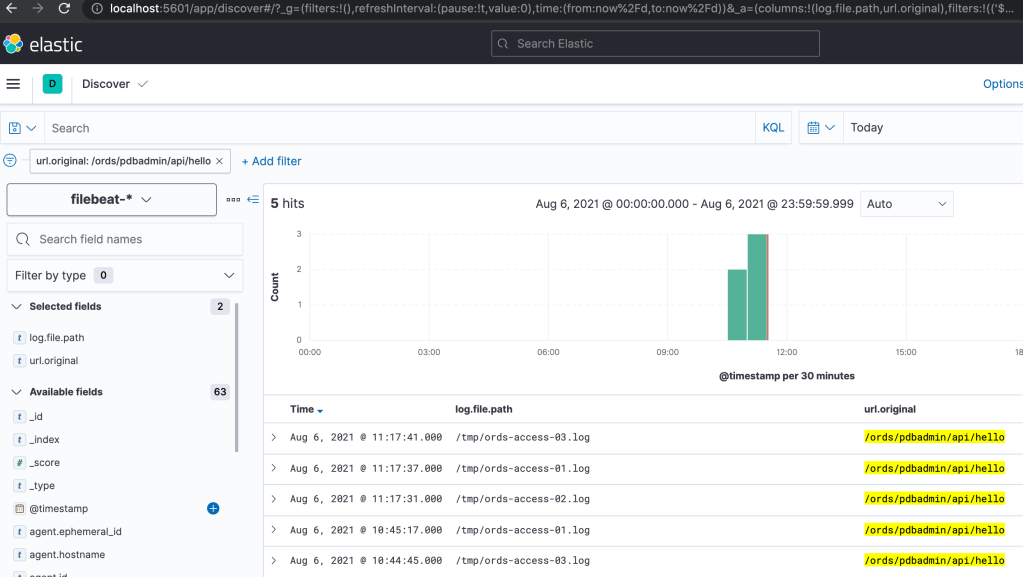
Follow the steps in ORDS Access Logs in Kibana for starting up Elasticsearch, Kibana and Filebeat. Once that’s all started, use your browser to access http://localhost:5601/ and navigate to Analytics/Discover to see all the log entries from all three access logs.

Using curl again, I have made some further requests to the ORDS REST service at http://localhost:8080/ords/pdbadmin/api/hello and can see that the requests are distributed across the three ORDS standalone instances.

Filebeat-* index pattern used to discover log entries for a specific URL

Summary

There are a number of processes running at this stage but one now has a visual representation of the access logs for each ORDS instances. To recap…

  • Three ORDS standalone instances listening on separate ports and recording access logs to separate files
  • NGINX Load Balancer listing on port 8080 and routing to all three ORDS instances using the default round robin policy
  • Elasticsearch is providing a datastore for log entries
  • Filebeat monitors the log files and pushes changes to Elasticsearch. It expects the file entries to be in an apache log format
  • Kibana provides browser based access to the data in Elasticsearch and has been configured with a Filebeat index pattern definition to make discovering log entries easier

With all this in place, one can see which ORDS instance processed a particular request.

ORDS Access Logs in Kibana

There are countless ways to go about Application Process Monitoring for ORDS. The right choice is contingent on so many factors. These include, but are not limited to : budget, topology, system management practices and familiarity with the tools. This article is not a recommendation but rather a demonstration of quickly getting started from scratch with a visual and searchable representation of every request received by ORDS Standalone.

To achieve this we’ll use some free products which work together with the minimum of fuss

  • Elasticsearch – Stores data for quick search and retrieval.
  • Kibana – Visual interface to Elasticsearch data.
  • Filebeat – Monitors log files and publishes changes to Elasticsearch. Also configures Kibana for showing dashboard, log entries from ElasticSearch.

ORDS Standalone Access Log

To get from zero to hero quickly we’re going to take advantage of out of the box configurations that Filebeat comes with. In this case, the support for the Apache combined log file format. So that we can have ORDS Standalone produce an access log with this format we’ll specify a CustomRequestLog instance in $CONFIG_DIR/ords/standalone/etc/jetty.xml. In this case $CONFIG_DIR is the ORDS configuration directory.

<?xml version="1.0"?>
<!DOCTYPE Configure PUBLIC "-//Jetty//Configure//EN" "http://www.eclipse.org/jetty/configure.dtd">
<Configure id="Server" class="org.eclipse.jetty.server.Server">
    <Ref id="Handlers">
      <Call name="addHandler">
        <Arg>
          <New id="RequestLog" class="org.eclipse.jetty.server.handler.RequestLogHandler">
            <Set name="requestLog">
              <New id="RequestLogImpl" class="org.eclipse.jetty.server.CustomRequestLog">
                <Arg>/ords/ords-access.log</Arg>
                <Arg>%{remote}a - %u %t "%r" %s %O "%{Referer}i" "%{User-Agent}i"</Arg>
              </New>
            </Set>
          </New>
        </Arg>
      </Call>
    </Ref>
</Configure>

The highlighted custom request log format is the Eclipse Jetty representation of the Apache combined log format.

Startup ORDS standalone ( java -jar ords.war standalone ) and every request and it’s response summary is logged to /ords/ords-access.log.

0:0:0:0:0:0:0:1 - - [23/Jul/2021:15:02:13 +0000] "GET /ords/pdbadmin/soda/latest/metadata-catalog/?limit=1000&offset=0&q=%7B%7D HTTP/1.1" 200 28 "http://localhost:8080/ords/pdbadmin/_sdw/?nav=application&application=soda&page=Home" "Mozilla/5.0 (Macintosh; Intel Mac OS X 10_15_7) AppleWebKit/537.36 (KHTML, like Gecko) Chrome/91.0.4472.164 Safari/537.36"
0:0:0:0:0:0:0:1 - - [23/Jul/2021:15:02:13 +0000] "PUT /ords/pdbadmin/soda/latest/CarsWorkshopTour HTTP/1.1" 201 0 "http://localhost:8080/ords/pdbadmin/_sdw/?nav=application&application=soda&page=Home" "Mozilla/5.0 (Macintosh; Intel Mac OS X 10_15_7) AppleWebKit/537.36 (KHTML, like Gecko) Chrome/91.0.4472.164 Safari/537.36"
0:0:0:0:0:0:0:1 - - [23/Jul/2021:15:02:14 +0000] "POST /ords/pdbadmin/soda/latest/CarsWorkshopTour?action=insert HTTP/1.1" 200 652 "http://localhost:8080/ords/pdbadmin/_sdw/?nav=application&application=soda&page=Home" "Mozilla/5.0 (Macintosh; Intel Mac OS X 10_15_7) AppleWebKit/537.36 (KHTML, like Gecko) Chrome/91.0.4472.164 Safari/537.36"

Setup the stack

Now that ORDS is logging every request we can install and configure the stack for monitoring and analysing the log entries. This can be done through docker containers or package managers but for clarity of the constituents we’ll go through the download and installation for macOs. Let’s assume the starting point is a directory called /ords-monitoring/ and we have three separate terminal shells for running Elasticsearch, Kibana and Filebeat. Having java in the path is a prerequisite for all three.

Elasticsearch

# Get and run Elasticsearch
wget https://artifacts.elastic.co/downloads/elasticsearch/elasticsearch-7.13.4-darwin-x86_64.tar.gz
tar -xzf elasticsearch-7.13.4-darwin-x86_64.tar.gz
./elasticsearch-7.13.4/bin/elasticsearch

# Once running the output will show something like this...
[2021-07-23T09:52:55,825][INFO ][o.e.c.r.a.AllocationService] [my-mac] Cluster health status changed from [YELLOW] to [GREEN] (reason: [shards started [[.kibana-event-log-7.13.4-000001][0]]]).

Kibana

# Get and run Kibana
wget https://artifacts.elastic.co/downloads/kibana/kibana-7.13.4-darwin-x86_64.tar.gz
tar -xzf kibana-7.13.4-darwin-x86_64.tar.gz
./kibana-7.13.4-darwin-x86_64/bin/kibana

# Once running the output will show something like this...
log   [09:52:52.152] [info][server][Kibana][http] http server running at http://localhost:5601

Filebeat

# Get, configure and run Filebeat
wget https://artifacts.elastic.co/downloads/beats/filebeat/filebeat-7.13.4-darwin-x86_64.tar.gz
tar -xzf filebeat-7.13.4-darwin-x86_64.tar.gz
cd ./filebeat-7.13.4-darwin-x86_64
# Check the setup.kibana: host and output.elasticsearch: hosts are uncommented in the base filebeat configuration.
vi filebeat.yml
# Enable the Apache module
./filebeat modules enable apache
# Edit the config to point to the /ords/ords-access*.log
vi modules.d/apache.yml
# Have Filebeat configure Kibana
./filebeat setup
# Run Filebeat
./filebeat -e

Note that the filebeat.yml may have the output.elasticsearch hosts list already uncommented but you may have to uncomment the setup.kibana entry.

...
# =================================== Kibana ===================================

# Starting with Beats version 6.0.0, the dashboards are loaded via the Kibana API.
# This requires a Kibana endpoint configuration.
setup.kibana:

  # Kibana Host
  # Scheme and port can be left out and will be set to the default (http and 5601)
  # In case you specify and additional path, the scheme is required: http://localhost:5601/path
  # IPv6 addresses should always be defined as: https://[2001:db8::1]:5601
  host: "localhost:5601"

...
# ---------------------------- Elasticsearch Output ----------------------------
output.elasticsearch:
  # Array of hosts to connect to.
  hosts: ["localhost:9200"]

  # Protocol - either `http` (default) or `https`.
  #protocol: "https"
...

When Filebeat has started processing the file specified by apache.access.var.paths ( e.g. /ords/ords-access.log) you should see the following:

2021-07-23T10:57:06.700+0100	INFO	[publisher_pipeline_output]	pipeline/output.go:151	Connection to backoff(elasticsearch(http://localhost:9200)) established
2021-07-23T10:57:32.706+0100	INFO	[monitoring]	log/log.go:144	Non-zero metrics in the last 30s	{"monitoring": {"metrics": {"beat":{"cpu":{"system":{"ticks":488,"time":{"ms":488}},"total":{"ticks":792,"time":{"ms":792},"value":792},"user":{"ticks":304,"time":{"ms":304}}},"info":{"ephemeral_id":"4432101e-4924-4c2a-835d-2da35c4551aa","uptime":{"ms":30288}},"memstats":{"gc_next":17666800,"memory_alloc":13072376,"memory_sys":75580416,"memory_total":46621616,"rss":73383936},"runtime":{"goroutines":43}},"filebeat":{"events":{"added":20,"done":20},"harvester":{"open_files":1,"running":1,"started":1}},"libbeat":{"config":{"module":{"running":1,"starts":1},"reloads":1,"scans":1},"output":{"events":{"acked":19,"active":0,"batches":1,"total":19},"read":{"bytes":10240},"type":"elasticsearch","write":{"bytes":25382}},"pipeline":{"clients":2,"events":{"active":0,"filtered":1,"published":19,"retry":19,"total":20},"queue":{"acked":19,"max_events":4096}}},"registrar":{"states":{"current":1,"update":20},"writes":{"success":2,"total":2}},"system":{"cpu":{"cores":4},"load":{"1":11.3442,"15":5.8877,"5":6.8467,"norm":{"1":2.8361,"15":1.4719,"5":1.7117}}}}}}

Kibana Analytics

You have used Filebeat to configure Kibana so point your browser to http://localhost:5601/ to get started with the reviewing and searching your ORDS access logs.

Please note that the convenience of such a quick setup has left out security configuration steps which are essential for a production environment. However, in less than 30 minutes you have put together a system where you can start learning more about one approach to monitoring ORDS.

Load Balancing ORDS with NGINX

For high availability, scalability and efficient use of computing resources many computing systems are deployed with a load balancer as the client facing interface which distributes the task load.

The product documentation for Oracle REST Data Services does not go into detail on how to put a load balancer in front of your ORDS instances because all of that documentation would be covering configuration specifics for another product. Namely, the load balancer of your choice.

Kris Rice has provided detailed steps on using ORDS with Consul and Fabio load balancer which is an excellent approach which requires very little configuration.

In this article I cover what is perhaps the quickest way to spin up a load balancer in front of your ORDS instances: NGINX with Load Balancing configuration and docker official NGINX image.

In my scenario I have ORDS running in a WebLogic Server on one machine and Tomcat on another. That’s server1:7001 and server2:8888 respectively, This isn’t your typical setup but since the headers returned by both containers are slightly different, it makes it clearer which server handled the request. Both ORDS instances are configured to talk to the same database where HR schema has an AutoREST EMPLOYEES table. That’s accessible at /ords/hr/employees/.

This nginx.conf has the bare minimum to get up and running.

events {}
http {
    upstream ords {
        server server1:7001;
        server server2:8888;
    }

    server {
        location / {
            proxy_pass http://ords;
            proxy_set_header Host $host;
        }
    }
}

It will route each request to one of the upstream servers in a round-robin fashion. Note the proxy_set_header directive. This is essential so that whichever ORDS instance receives the request it knows what URL the client submitted to make the request. Having valid absolute Link Relation URLs in the response relies on this.

Assuming your working directory is the same directory where you have this nginx.conf just spin up a docker container:

docker run -p 8080:80 -v ${PWD}/nginx.conf:/etc/nginx/nginx.conf:ro -d nginx

The port mapping is up to you. By default the docker nginx will listen on port 80 and in this case I have it mapped to 8080 on the host machine.

Now a request to http://localhost:8080/ords/hr/employees/ will be routed to the whatever server is next in the round-robin list.

Tomcat response
WebLogic Server response

Note that in both cases the ETag header is the same because the same response body is being returned to the client each time for the same URL http://localhost:8080/ords/hr/employees/.

It’s that quick and easy. I’ll leave it to you to discover what happens when one or both ORDS instances are stopped and to refer to NGINX documentation on configuring it for high availability.


The next article in this series HTTPS Load Balance: NGINX & ORDS will build on this NGINX concept and go through the steps of generating a self signed certificate so that HTTPS traffic can be encrypted.


Duplicate stream parameter

Oracle REST Data Services has a useful Implicit Parameter feature which conveniently are automatically available to use in Resource Module Handlers without declaring them. More information about Resource Module Handlers is available in the Developing Oracle REST Data Services Applications section of the ORDS documentation.

Amongst other things, these implicit parameters provide access to the request body for a POST or PUT either as a BLOB through :body or CLOB through :body_text. For both parameters the documentation says they should only be referred to once.

parameter must be dereferenced only once in a PL/SQL block.

ORDS Implicit Parameter documentation

The documentation for the :body implicit parameter explains why. If it is dereferenced more than once, then the second and subsequent dereferences will appear to be empty. This is because the client sends the request body only once. So the first :body reference will return a BLOB but the second reference will return null. The same applies to :body_text which is a CLOB representation of the same request body.

That is in the Resource Module Handler PL/SQL block if the source references :body and then :body_text the :body_text will return null.

begin
 insert into tab1(content) values (:body); -- request body will be inserted
 dbms_output.put_line('Request body ' || :body_text); -- request body will be null
end;

However, a second call to :body_text will result in an error at runtime – SQL Error Code: 17270, Error Message: Duplicate stream parameter: 2.

begin
 dbms_output.put_line('Request body ' || :body_text); -- request body as CLOB
 dbms_output.put_line('Request body ' || :body_text); -- error occurs
end;

There is an inconsistency here in how a second call to get the request body content is handled but if you’re getting this Duplicate steam parameter error message do review the source for duplicate references to :body_text implicit parameter.

Tomcat ~ override that web.xml

For many, their first experience with Java Servlets and Java Server Pages was on Apache Tomcat. For decades Tomcat has been a viable production platform for Java web applications. It’s Open-Source, free, configurable and stable.

Like many web applications, the Oracle REST Data Services application can be automatically deployed in a running Tomcat container just by copying the ords.war to the host’s appBase ( $CATALINA_BASE/webapps by default). There is a prerequisite step though. The ords.war must be updated with the location of the configuration directory. That location is written to the web.xml as a <context-param> called config.dir.

Since ORDS a standard Java web application, Tomcat can be configured to use a different web.xml than what is in the WAR file. There are not many valid cases where one might wish to do this though and there are often better alternatives. For example, if you want the ords.war to be unchanged but use a different database, just update the files in the configuration directory. That’s what they are there for.

Perhaps there are additional settings you want to define for your environment that are only applicable to the ORDS web application. Those entries probably don’t belong in the central server.xml or web.xml. So what can one do? Once an application is deployed, the web.xml can be edited in $CATALINA_BASE/webapps but those changes are transient and may not survive a server restart. One approach is to use a Context configuration file for the deployment. Here’s an example, using a Tomcat 9.0.29 server with the default configuration.

In my case, I want to have a different display name and point the config.dir to a different location. This allows me to have the exact same ords.war used in two different Tomcat servers. Let’s say that my ords.war config.dir has the correct location for where to find the configuration files on the production server, but I want to use the exact same war, unmodified on a developer server for testing.

Note that the approach outlined here is not specific to ORDS and applies to any web application in Tomcat.

So I define my custom web.xml for ORDS and call it ords_tomcat_test_web.xml because that sounds descriptive enough. I’m changing the display name to Oracle REST Data Services on Apache Tomcat and the config.dir to /scratch/ords_conf. Let’s say the previous values were Oracle REST Data Services and /u01/oracle/ords/config/ respectively.

<?xml version="1.0" encoding="UTF-8"?>
<web-app xmlns="http://java.sun.com/xml/ns/j2ee" id="WebApp_ID" version="2.4" xmlns:xsi="http://www.w3.org/2001/XMLSchema-instance" xsi:schemaLocation="http://java.sun.com/xml/ns/j2ee http://java.sun.com/xml/ns/j2ee/web-app_2_4.xsd">
	<display-name>Oracle REST Data Services on Apache Tomcat</display-name>

	<context-param>
		<param-name>config.dir</param-name>
		<!-- Enter the location where configuration settings should be stored -->
		<param-value>/scratch/ords_conf</param-value>
	</context-param>
	<context-param>
		<param-name>version</param-name>
		<param-value>20.3.0.301.1819</param-value>
	</context-param>

	<listener>
		<listener-class>oracle.dbtools.entrypoint.WebApplicationEntryPoint</listener-class>
	</listener>

	<servlet>
		<description>
		</description>
		<display-name>HttpEndPoint</display-name>
		<servlet-name>HttpEndPoint</servlet-name>
		<servlet-class>oracle.dbtools.entrypoint.WebApplicationRequestEntryPoint</servlet-class>
	</servlet>

	<servlet-mapping>
		<servlet-name>HttpEndPoint</servlet-name>
		<url-pattern>/*</url-pattern>
	</servlet-mapping>

	<servlet>
		<description>
		</description>
		<display-name>Forbidden</display-name>
		<servlet-name>Forbidden</servlet-name>
		<servlet-class>oracle.dbtools.entrypoint.Forbidden</servlet-class>
	</servlet>

	<servlet-mapping>
		<servlet-name>Forbidden</servlet-name>
		<url-pattern>/oracle/dbtools/jarcl</url-pattern>
	</servlet-mapping>

	<welcome-file-list>
		<welcome-file>index.html</welcome-file>
		<welcome-file>index.htm</welcome-file>
		<welcome-file>index.jsp</welcome-file>
		<welcome-file>default.html</welcome-file>
		<welcome-file>default.htm</welcome-file>
		<welcome-file>default.jsp</welcome-file>
	</welcome-file-list>

</web-app>

To tell Apache Tomcat to use this ords_tomcat_test_web.xml instead of the web.xml in the ords.war I define a Context configuration xml file in $CATALINA_BASE/conf/[enginename]/[hostname]/. In my case $CATALINA_BASE/conf/Catalina/localhost/ords.xml and the entry defines a altDDName attribute. The value is the absolute path to the alternative deployment descriptor for this context. This overrides the default deployment descriptor located at /WEB-INF/web.xml.

<?xml version="1.0" encoding="UTF-8"?>
<Context altDDName="/scratch/ords_tomcat_test_web.xml">
</Context>

The link between the Context configuration and the ords.war is that, ignoring suffix, they have the same filename. ords.xml is the Context configuration for ords.war. At startup, Tomcat will expect to find an ords web application in the webapps directory. If ords.war is not there, Tomcat will still attempt to deploy a web application with the path /ords. An error will show in the logs, and since there’s no real application to run, it will not be in a started state but will be deployed.

2020-12-16T12:45:05.831Z INFO        Deploying deployment descriptor [/scratch/apache-tomcat-9.0.29/conf/Catalina/localhost/ords.xml]
2020-12-16T12:45:05.838Z SEVERE      Error deploying deployment descriptor [/scratch/apache-tomcat-9.0.29/conf/Catalina/localhost/ords.xml]
java.lang.IllegalStateException: Error starting child
	at org.apache.catalina.core.ContainerBase.addChildInternal(ContainerBase.java:720)
	at org.apache.catalina.core.ContainerBase.addChild(ContainerBase.java:690)

... removed for brevity ...

2020-12-16T12:45:05.839Z INFO        Deployment of deployment descriptor [/scratch/apache-tomcat-9.0.29/conf/Catalina/localhost/ords.xml] has finished in [7] ms

Just drop in the ords.war as you would with any other web application for auto deployment and Tomcat picks up the change…

2020-12-16T12:46:25.877Z INFO        Reloading context [/ords]
2020-12-16T12:46:34.238Z INFO        Configuration properties for: |apex|pu|
database.api.enabled=true
db.connectionType=basic
db.hostname=localhost
db.port=1521
db.servicename=mydevdb

... removed for brevity ...

2020-12-16T12:46:46.402Z INFO        Oracle REST Data Services initialized
Oracle REST Data Services version : 20.3.0.r3011819
Oracle REST Data Services server info: Apache Tomcat/9.0.29

The configuration properties are being picked up from /scratch/ords_conf/ords/defaults.xml which point to mydevdb. Also the display name is coming from the alternative deployment descriptor.

Display name from customer deployment descriptor

Auto deployment continues to work and the Context configuration survives restarts. Keep in mind that undeploying the application will remove the Context configuration ords.xml as well as the application files from webapps.

Note that this is not the prescribed way to use ORDS in Tomcat and providing your own web.xml to override the package one may result in unspecified behaviour with future versions of ORDS or Tomcat.