When it comes to deploying Oracle REST Data Services (ORDS), there are three main options to consider: Standalone, Apache Tomcat, and Oracle WebLogic Server. Each has its own advantages and drawbacks, so it’s important to understand the differences between them before choosing a deployment option.
ORDS Standalone
ORDS Standalone is the simplest deployment option and requires no external application servers. In fact, once you have ORDS, you have all you need to get started. It uses the Eclipse Jetty server embedded in ORDS, which is suitable for development, testing and production environments. It’s easy to set up and manage. It’s simplicity makes it ideal for smaller workloads but can also scale for high availability and greater throughput when a load balancer is put in front multiple ORDS standalone instances.
To run ORDS in standalone mode: ords --config /path/to/config/ serve
One should note that although using ORDS with Apache Tomcat or Oracle WebLogic Server is supported, quite often the diagnosis process for any support issues will involve verifying if the issue also occurs with ORDS standalone.
As mentioned in a previous article about Application Process Monitoring, when running in standalone mode, ORDS loads the jars from the ords.war into memory and some Java Agents which modify jars to instrument classes at the byte level can interfere with that classloading process. Examples of Java Agents which can not be used when ORDS standalone mode is used: Oracle APM Java Agent, DynaTrace Java Monitoring. However, there is a workaround to have ORDS working with Oracle APM Java Agent which you should be aware of.
Pros:
Easy to set up and manage. Get started straight away!
Can generate a convenient self-signed certificate for HTTPS.
Suitable for development and testing.
Ideal for a variety of workloads.
ORDS configuration of embedded Jetty server optimised for REST services.
Jetty configuration is extensible using XML files.
Cons:
Limited integration with identity and authorisation management systems.
Requires a load balancer for high availability.
Does not work with some Java Agents.
April 2024 Update !
ORDS 24.1.0 no longer has this Java Agent / Classloader issue.
Use ORDS 24.1.0 or a later version when using DynaTrace, Oracle APM or any other Java Agent.
ORDS Deployment to Tomcat
Apache Tomcat powers numerous large-scale, mission-critical web applications across a diverse range of industries and organisations. Chances are that your organisation is already running at least one Apache Tomcat servlet container. Tomcat is a popular open-source web server that is well-suited to ORDS.
It’s easy to set up, and deploying ORDS to Apache Tomcat is as simple as ords --config /path/to/config/ war $CATALINA_HOME/webapps/ords.war
Of course, that’s if your Tomcat configuration has auto deployment enabled, which is the default setting. Similar to ORDS standalone, Tomcat is configured to be reasonably secure for most use cases by default. Also, similar to ORDS standalone, for high availability a load balancer / reverse proxy must be configured to route to the servers.
Pros:
Integration with identity and authorisation management systems, such as Active Directory, OpenID Connect, through container managed security.
Suitable for production workloads.
Easy to get started with: install Apache Tomcat, start it, generate the ords web application, done.
Free.
Cons:
Involves an additional server.
More complex to manage than ORDS Standalone for clustering – see Tomcat Cluster documentation. Moreover, since ORDS is stateless, session serialisation, which is a common characteristic of web server clustering, that aspect of most clustered systems is not required.
ORDS Deployment to WebLogic
Oracle WebLogic Server is a unified and extensible platform for developing, deploying and running enterprise applications, such as Java, for on-premises and in the cloud. ORDS deployment to WebLogic is a very robust option. Weblogic is a powerful and reliable application server and provides advanced features such as clustering and load balancing. It’s suitable for large-scale production workloads. However, provisioning and configuring an Oracle Weblogic domain can be complicated.
The steps for deploying ORDS to WebLogic are involved and it’s best to refer to ORDS documentation.
Pros:
Provides advanced features such as clustering and load balancing
Suitable for large-scale production workloads
Robust and reliable
Integration with identity and authorisation management systems, such as Active Directory, OpenID Connect, through container managed security.
Cons:
Requires an Oracle WebLogic application server licence for production
Complex to set up and manage but is fairly standard for an enterprise grade application server
Decision Factors
Ultimately, the deployment option that’s best for you depends on the complexity of your integration with other systems. What your organisation already uses, and has support in place for, is also an important factor. ORDS standalone is ideal for getting started, developing and testing new services before deployment to product. It’s also suitable for production workloads. What it misses out of the box is integration with identity and authorisation management systems. That’s essentially the gap that deployment on Tomcat and Weblogic addresses. In all three cases, each mode is suitable for large-scale production workloads with appropriate load balancing in place.
Post Publishing Edits:

February 20th 2023 - Added text about some Java Agents not working with ORDS standalone.
February 25th 2023 - Added text pointing out that ORDS does not retain session state.
October 5th 2023 - Added text about workaround for Oracle APM Java Agent NullPointerException.
April 11th 2024 - Added text stating that ORDS 24.1.0 has a fix for the Java Agent/Classloader exception.
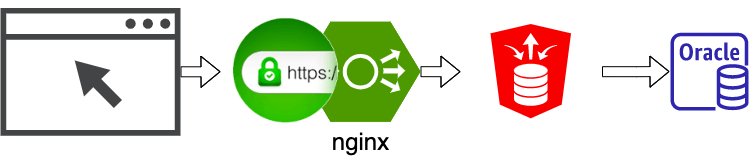
This article is part of a series about using ORDS on Docker with NGINX, SSL and Oracle Autonomous Database. The previous article is Load Balancing ORDS with NGINX which introduced the concept of load balancing and the most basic of configurations to get started with NGINX running in docker. That was entirely using HTTP as the transport protocol.
Around this time two years ago, in the Load Balancing ORDS with NGINX article, I covered what was certainly the quickest way to spin up a load balancer in front of your ORDS instances: NGINX with Load Balancing configuration and docker official NGINX image. It’s time to build on that to configure the load balancer for HTTPS traffic and to demonstrate that not only is a round robin routing policy in place but also the desired failover / recovery when an ORDS instance is stopped and started.
In this article I will go through the steps of generating a self signed certificate so that HTTPS traffic can be encrypted. Then I will walk through the configuration of NGINX to receive requests over HTTPS and distribute those requests to ORDS instances running on the same machine which accept unencrypted traffic. The first thing we need are two ORDS instances configured for the same database.
ORDS Instances
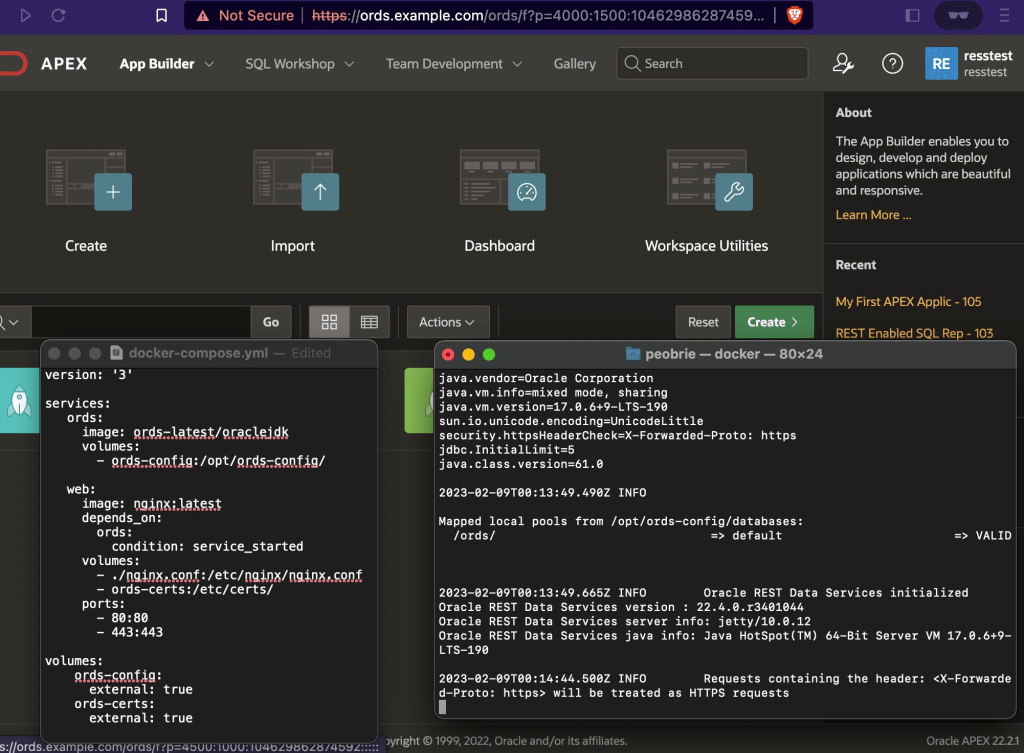
In this example there is one database and two ORDS instances running in standalone mode on different ports. Both ORDS instances will be sharing the same configuration directory. The configuration directory not only contains the pool and global settings but the global/doc_root directory contains the APEX image files that are required for Oracle APEX to operate. It is recommended to use the APEX CDN where possible but in this case the files have been downloaded and extract from apex.oracle.com.
The configuration is fairly standard but there are two important configuration settings needed so that the ORDS instances will accept requests from the load balancer over HTTP even though the load balancer is receiving the requests over HTTPS. These settings are security.httpsHeaderCheck and security.externalSessionTrustedOrigins.
~/Downloads/ords-22.4.3.033.1239/bin/ords --config /path/to/config config set security.httpsHeaderCheck "X-Forwarded-Proto: https"

~/Downloads/ords-22.4.3.033.1239/bin/ords --config /path/to/config config set security.externalSessionTrustedOrigins "https://ords.example.com"
You’ll notice that the most recent released version of ORDS is being used from the downloads directory that it was extracted to. Of course you are free to download and run ORDS in whatever directory makes sense for your system.
The security.httpsHeaderCheck setting tells ORDS what header, and value, to look for to confirm that the load balancer received the request over HTTPS. The security.externalSessionTrustedOrigins setting tells ORDS that requests with these Origin values can be trusted in a secured context.
The ORDS instances are started in two separate terminal windows relying on 8080 to be the default port for one and specifying 8090 as the port for the second instances.
~/Downloads/ords-22.4.3.033.1239/bin/ords --config /path/to/config serve
...
Configuration:
  /path/to/config

INFO        HTTP and HTTP/2 cleartext listening on host: 0.0.0.0 port: 8080
INFO        The document root is serving static resources located in: /path/to/config/global/doc_root
...
INFO        Oracle REST Data Services initialized
Oracle REST Data Services version : 22.4.3.r0331239
Oracle REST Data Services server info: jetty/10.0.12
Oracle REST Data Services java info: Java HotSpot(TM) 64-Bit Server VM 11.0.13+10-LTS-370
~/Downloads/ords-22.4.3.033.1239/bin/ords --config /path/to/config serve --port 8090

...
Configuration:
  /path/to/config

INFO        HTTP and HTTP/2 cleartext listening on host: 0.0.0.0 port: 8090
INFO        The document root is serving static resources located in: /path/to/config/global/doc_root
...
INFO        Oracle REST Data Services initialized
Oracle REST Data Services version : 22.4.3.r0331239
Oracle REST Data Services server info: jetty/10.0.12
Oracle REST Data Services java info: Java HotSpot(TM) 64-Bit Server VM 11.0.13+10-LTS-370
There are going to be files involved in this exercise and instead of repeating which files are where I’ll outline the folder structure for the nginx configuration here. Everything is going to exist under a directory called ords-nginx in the user home directory.
~/ords-nginx/ directory structure
|
|-nginx.conf <- configuration file
|-certs/
     |-nginx.crt <- certificate for the domain
     |-nginx.key <- RSA private key
Certificate for HTTPS
A certificate is required for HTTPS to make sure that the website you are visiting is secure. Secure in this context means that the data sent between client and website is not intercepted by malicious actors. Without the certificate, the website would not be secure, and any data sent between the website and the user could be compromised. In general, certificates are issued by Certificate Authorities ( CA) that are trusted by most browsers. In this article, for convenience, we’ll use a self signed certificate rather than one issued by a CA.
A self-signed SSL certificate is an identity certificate that is signed and issued by the same entity that is using it. It is used to secure a network connection between two or more systems and is used to prove the identity of a server or website. Self-signed SSL certificates are free to generate, but they are not trusted by web browsers and other clients, so they are not recommended for use on public websites. They are, however, useful for internal networks, where trust is already established.
The certificate Common Name attribute corresponds to the website address. Typically there would be a domain name service ( DNS ) which resolves that name to a specific IP address and server. In this article I’m taking a short cut and not using a DNS but rather telling my machine that ords.example.com is actually the local IP address 127.0.0.1. There are other options such as Dnsmasq that can make defining a custom domain name in your network a bit easier. For now, I have an entry in /etc/hosts that looks like this:
##
# Host Database
#
# localhost is used to configure the loopback interface
# when the system is booting.  Do not change this entry.
##
127.0.0.1	localhost
127.0.0.1       ords.example.com
When I send a request to https://ords.example.com/ it will be routed to the 127.0.0.1 loopback address. Now that little bit of network traffic configuration is in place it’s time to create a self signed certificate for the ords.example.com host name. Browsers will report the self signed certificate as Not Secure because it can not be verified with a trusted Certificate Authority, but the traffic will be encrypted.
The goal is to have a self signed certificate for traffic to an address that is actually a local machine
Self Signed Certificate
A self signed certificate is a certificate that is not signed by a trusted Certificate Authority (CA) and is used for testing purposes or for applications that are only accessed within a trusted network. In other words, not accessed from the internet. If your goal is to have nginx as a load balancer accepting traffic from the public then after you have completed the setup in this article, replace the self signed certificates with a certificate for your domain which you have obtained from a CA.
To generate our self signed certificate for ords.example.com we’ll use openssl which is most likely already installed on your operating system. Open a terminal window, change your working directory to ~/ords-nginx/ and follow these steps to create a self signed certificate using openssl.
Generate a Private Key and Certificate
A public-private key pair is a set of two cryptographic keys, consisting of a public key and a private key. The public key is used for encryption and decryption, while the private key is used for signing and verification. Public keys are exchanged between two parties and can be used to encrypt data to be sent securely. Private keys are kept secret and are used to prove the identity of the sender. The two keys are mathematically related and are used together to establish a secure communication link.
Using openssl one can have separate distinct steps to generate a private key, generate a Certificate Signing Request and generate the certificate. We can also do all that with a single openssl command executed in the ~/ords-nginx/ directory:
> openssl req -x509 -nodes -days 365 \
              -newkey rsa:2048 \
              -keyout certs/nginx.key \
              -out certs/nginx.crt

Generating a 2048 bit RSA private key
.................................................+++++
....+++++
writing new private key to 'certs/nginx.key'
-----
You are about to be asked to enter information that will be incorporated
into your certificate request.
What you are about to enter is what is called a Distinguished Name or a DN.
There are quite a few fields but you can leave some blank
For some fields there will be a default value,
If you enter '.', the field will be left blank.
-----
Country Name (2 letter code) []:
State or Province Name (full name) []:
Locality Name (eg, city) []:
Organization Name (eg, company) []:
Organizational Unit Name (eg, section) []:
Common Name (eg, fully qualified host name) []:ords.example.com
Email Address []:
That will generate a 2048-bit RSA private key called nginx.key and a self signed certificate for the ords.example.com host name called nginx.crt. You will note that the majority of prompts are left empty and the only field that a value is entered for is Common Name. And that’s it! You have successfully created a self signed certificate using openssl and that certificate will remain valid for 365 days. You can now use this certificate with nginx.
NGINX
This section has two parts: create the configuration and run the nginx docker container with that configuration.
Configuration
Create the ~/ords-nginx/nginx.conf file as below. I will summarise what each line does but you should refer to nginx documentation for further details on the nginx configuration entries.
# No specific connection processing instructions
events {}

# The configuration for http(s) traffic
http {
# Log format to use for access log.
# This will show which server a request gets routed to.
    log_format upstreamlog '$server_name to: $upstream_addr {$request} '
   'upstream_response_time $upstream_response_time'
   ' request_time $request_time';

# List of servers to route to. Call that list 'ords'.
# Running in docker so host.docker.internal used to point to
# host machine which is running ORDS instances.
    upstream ords {
        server host.docker.internal:8080;
        server host.docker.internal:8090;
    }

# Configure a http server for port 80
# All requests are redirected to https
    server {
        listen 80 default_server;
        listen [::]:80 default_server;
        server_name _;
        return 301 https://$host$request_uri;
    }

# Configure a https server for port 443
    server {
        listen 443 ssl default_server;
        listen [::]:443 ssl default_server;
        ssl_certificate /etc/certs/nginx.crt;
        ssl_certificate_key /etc/certs/nginx.key;
# Specify the format to apply to access log
        access_log /var/log/nginx/access.log upstreamlog;
# Any requests get passed upstream to the 'ords' list
        location / {
            proxy_pass http://ords;
# Tells the upstream server what hostname the client used
            proxy_set_header Host $host;
# Tells the upstream server that https was used
            proxy_set_header X-Forwarded-Proto https;
        }
    }
}
The very first line is an empty events {} section. This is the section where directives that affect connection processing are specified. We have no particular connection processing needs beyond the default so it’s left empty. If we didn’t have this section here a [emerg] no “events” section in configuration message will appear in the logs.
The http section of the configuration has the important stuff. In that, as outlined by the above comments we have:
An access log format which will include information on which upstream server a request is routed to. This will be useful later to confirm round-robin routing and seamless failover / recovery occurs.
A list of servers to route traffic to. We have two in this example but it could be any number of ORDS instances.
A server configuration to listen on port 80 but redirect all requests to use HTTPS and therefore port 443.
A server configuration to list on port 443
Specifies the file paths for the certificate and key files we generated earlier.
Specifies the access log format to use.
Specifies that for any location in the request URL the requested should be routed the ‘ords’ upstream servers.
Irrespective of what the upstream server host name is, the Host header is set to whatever the client provided in the request. This is essential so that when ORDS must generated absolute URL values for a response the URL will be usable to the client.
A header is set which corresponds to the ORDS configuration security.httpsHeaderCheck which was mentioned at the top of this article. This confirms to ORDS that although the upstream server received a request over HTTP, the load balancer received the request from the client over HTTPS.
Now that you have an NGINX configuration file it can be put to work.
Run
The ORDS instances are running in standalone mode, listening for HTTP requests on port 8080 and 8090 respectively. Let’s start NGINX in a docker container. While still in that ~/ords-nginx/ directory run the following:
That will run NGINX in a docker container using the specific configuration as well as certificate and key files. Since the -d option is specified, the container is running in the background so the only output you will have seen is a long list of letters and numbers which is the container id. It will look like: 422598c154ee68db4ee6ffd3ed91e591fa19215539b3486517842f0ac47c6874
For a more human friendly way of referring to the container you can use the name which was automatically generated for it. You could run docker ps to get a list of the running containers and look for the nginx one or use docker inspect to get the container name.
Your container name will be different. The leading slash can be ignored. Let’s use that name to tail the docker container log.
> docker logs -f /epic_gates

docker logs -f /epic_gates
/docker-entrypoint.sh: /docker-entrypoint.d/ is not empty, will attempt to perform configuration
/docker-entrypoint.sh: Looking for shell scripts in /docker-entrypoint.d/
/docker-entrypoint.sh: Launching /docker-entrypoint.d/10-listen-on-ipv6-by-default.sh
10-listen-on-ipv6-by-default.sh: info: Getting the checksum of /etc/nginx/conf.d/default.conf
10-listen-on-ipv6-by-default.sh: info: Enabled listen on IPv6 in /etc/nginx/conf.d/default.conf
/docker-entrypoint.sh: Launching /docker-entrypoint.d/20-envsubst-on-templates.sh
/docker-entrypoint.sh: Launching /docker-entrypoint.d/30-tune-worker-processes.sh
/docker-entrypoint.sh: Configuration complete; ready for start up
Leave that tailing log open because we’re now going to use it to see the load balancer at work.
Try it out
This section is where the rubber hits the road. We’ll look at confirming round robin balancing, the redirect from HTTP to HTTPS, as well as the failover and recovery when upstream servers go down or come back up again.
Balancing act – round robin
Perform a simple test be running the following curl command twice:
The response will indicate that you are talking to nginx and that the request was processed without error. Those curl command options are important. The --head option means that the request action is HEAD and not GET so there’s no body in the response to display and the --insecure option means do not verify the certificate that the server is using. The latter part is important because the certificate is not signed by any trusted CA. What’s significant at this stage is what shows up in the nginx log. See how there are two entries because we had two requests. One went to upstream server listening on port 8080 and the next request went to the next server. That’s round robin routing in action.
 to: 192.168.5.2:8080 {HEAD /ords/sql-developer HTTP/1.1} upstream_response_time 0.022 request_time 0.022
 to: 192.168.5.2:8090 {HEAD /ords/sql-developer HTTP/1.1} upstream_response_time 0.019 request_time 0.019
Forcing HTTPS
In the nginx.conf we have a server definition which redirects all HTTP traffic on port 80 to HTTPS on port 443. This can be verified very simply with a request to a HTTP.
> curl --insecure --include http://ords.example.com/ords/sql-developer
HTTP/1.1 301 Moved Permanently
Server: nginx/1.23.3
Date: Sun, 12 Feb 2023 00:07:51 GMT
Content-Type: text/html
Content-Length: 169
Connection: keep-alive
Location: https://ords.example.com/ords/sql-developer

<html>
<head><title>301 Moved Permanently</title></head>
<body>
<center><h1>301 Moved Permanently</h1></center>
<hr><center>nginx/1.23.3</center>
</body>
</html>
Failover and Recover
The load balancer can share the request processing load across upstream servers but that is not the only thing it brings to the party. When there is a new release of ORDS it would be great to have little, or even none what so ever, downtime while doing the upgrade. When one server is brought down, nginx will identify that it is no longer available and will seamless hand the request over to the next server. The load balancer will continue to check on all upstream servers and when a server is back online will proceed to route requests to it. Let’s take a look at that failover and recovery.
In this example I’ll use APEX (https://ords.example.com/ords/) but you could use SQL Developer Web (https://ords.example.com/ords/sql-developer) if your environment does not have an APEX installation.
Open a browser to https://ords.example.com/ords/ and if you have not done so already, acknowledge the browser’s warning about the self signed certificate and proceed to the page. Login to APEX and navigate through the dashboard. In the nginx docker container log you will see the requests being routed to upstream server ports 8080 and 8090.
to: 192.168.5.2:8080 {GET /ords/f?p=4050:9:13779192078464::::: HTTP/1.1} upstream_response_time 3.288 request_time 3.288
to: 192.168.5.2:8090 {GET /i/libraries/jquery-migrate/3.4.0/jquery-migrate-3.4.0.min.js?v=22.2.0 HTTP/1.1} upstream_response_time 0.008 request_time 0.008
to: 192.168.5.2:8080 {GET /i/libraries/apex/minified/widget.report.min.js?v=22.2.0 HTTP/1.1} upstream_response_time 0.004 request_time 0.005
to: 192.168.5.2:8090 {GET /i/libraries/oraclejet/12.1.3/js/libs/oj/v12.1.3/resources/nls/localeElements.js HTTP/1.1} upstream_response_time 0.010 request_time 0.009
to: 192.168.5.2:8080 {GET /i/apex_ui/img/favicons/favicon.ico HTTP/1.1} upstream_response_time 0.008 request_time 0.008
Now shutdown the ORDS instance that is listening on port 8080 but continue to navigate around APEX in the browser. Although no error displayed in the browser you will see an upstream routing failure mentioned in the logs and then handing that request over to the next upstream server. Then all subsequent requests only go to that upstream server listening on port 8090.
Bring the first ORDS server back up while continuing to use APEX in your browser and you’ll see it does not take long before we’re back to a round robin routing to both upstream servers.
to: 192.168.5.2:8090 {GET /ords/f?p=4050:9:13779192078464::::: HTTP/1.1} upstream_response_time 3.859 request_time 3.859
to: 192.168.5.2:8090 {GET /i/libraries/jquery-migrate/3.4.0/jquery-migrate-3.4.0.min.js?v=22.2.0 HTTP/1.1} upstream_response_time 0.008 request_time 0.009
to: 192.168.5.2:8080 {GET /i/libraries/apex/minified/widget.report.min.js?v=22.2.0 HTTP/1.1} upstream_response_time 0.082 request_time 0.082
to: 192.168.5.2:8090 {GET /i/libraries/oraclejet/12.1.3/js/libs/oj/v12.1.3/resources/nls/localeElements.js HTTP/1.1} upstream_response_time 0.005 request_time 0.005
to: 192.168.5.2:8080 {GET /i/apex_ui/img/favicons/favicon.ico HTTP/1.1} upstream_response_time 0.007 request_time 0.007
Trust me
The first time you point your browser to the https://ords.example.com there will be an error displayed because the certificate presented by nginx is self signed. Your browser is unable to verify the certificate and will display an ERR_CERT_AUTHORITY_INVALID message. However, since you know that you have generated the certificate yourself you can tell the browser to proceed.
The browser can also show you the information it has received from the certificate.
You can proceed to use ORDS through nginx with this certificate or arrange for a certificate issued by a certificate authority.
Conclusion
If you’ve gotten this far and followed the steps, you can now run a secure HTTPS load balancer in front of multiple ORDS instances. Congratulations!
As mentioned in a previous article about NGINX, those ORDS instances could be on Apache Tomcat, Oracle WebLogic Server and as shown in this article, ORDS standalone too.
These articles are part of a series that will cover taking advantage of containerised services for using ORDS in the most optimal, scalable and robust manner possible. Stay tuned.
Scaling ORDS and NGINX with docker compose
The next article in this series Get started with Oracle REST Data Services (ORDS) and Docker will build on this NGINX configuration to show you how to quickly get started using ORDS and Docker. Together we will walk through the basics of building the Docker image, storing configuration in a Docker volume, running multiple ORDS instances and balancing the load using NGINX.
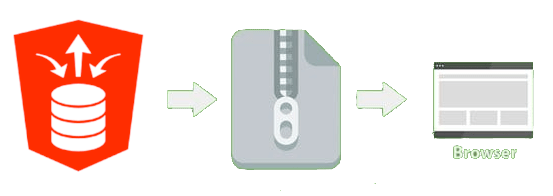
In the previous article, “Optimise Java settings with Application Process Monitoring“, we discussed how to get an insight on memory usage, CPU load, and response times. In this article, we will build on this knowledge by exploring the why, how and when on reducing response size by compressing ORDS responses with GZIP. This can be an effective way to reduce response size and ultimately improve response times as experienced by the end users. That can be especially important in systems where network latency to clients is a challenge. We will look at how to configure GZIP, and explore the trade-offs associated with response size versus CPU load.
GZIP Compression
Http clients, such as a web browser, indicate that they can accept a compressed response by listing the encoding algorithms they understand in the Accepts-Encoding header of the request. GZIP compression is a widely used compression algorithm for unix-based systems that has been around for more than two decades. It allows for reduced bandwidth between a web server and web client, resulting in faster page loading times.
Configuring a web server to compress content responses prior to transmission is beneficial, but it should not be done indiscriminately as it does consume CPU resources. It should be noted that compression can apply to the request received, as well as the response returned but in this article the focus is on making that response size smaller.
How much smaller? On average, one could be looking at response sizes being approximately 15% of the uncompressed file size.
Compression is not a silver bullet. There are file types, such as most image files and PDF documents, that are already compressed so attempting to compress them again is a waste of CPU cycles. Similarly, small files may not justify the computational cost for a relatively insignificant gain. In fact, if you’re compressing files that are smaller than the Maximum Transmission Unit (MTU) size of a TCP packet (1500 bytes), you are wasting CPU cycles. To ensure that the compression is effective, you should limit it to files with a size greater than 1.4KB (1400 bytes).
Let Jetty Handle Compression
When ORDS is running in standalone mode it is running a specially configured instance of Eclipse Jetty as the web server for receiving HTTP(S) requests. GZIP is so widely used that Eclipse Jetty has a dedicated GZipHandler for requests and responses. In this article we will extend the ORDS standalone jetty server, using a jetty XML configuration file, to apply the handler to responses. When using Eclipse Jetty, you can configure your server to use compression for all responses, or only for responses that meet certain criteria. This flexibility allows you to tailor your server response compression settings to fit your specific needs. In this case, compression will be applied for certain mime-types where compression could help, and when the response size is greater than 128 bytes. That’s quite a low maximum size and there may not be any performance improvement gained but it does allow the demonstration of compression being applied to almost every response.
Note that in this example compression will be applied only for responses to GET requests. This is the default behaviour. However, you can use the GZipHandler documentation to guide you on configuring for more complicated scenarios.
When ORDS is running in a standalone mode, the Eclipse Jetty Home is ${configuration.directory}/global/standalone/. The Jetty XML syntax can be used to configure the Jetty Server for additional functionality by placing configuration XML files in the Jetty Home etc directory. The capability to do this is provided through the Eclipse Jetty server product.
ORDS 22.4 Installation and Configuration Guide
Here’s my ${configuration.directory}/global/standalone/etc/jetty-compression.xml configuration file that inserts the GzipHandler to the ORDS standalone jetty server instance.
When ORDS is started in standalone mode with the above file in the configuration directory Eclipse Jetty Home etc folder, all responses will pass through the GzipHandler instance.
> ords --config /path/to/config serve

ORDS: Release 22.4 Production on Fri Feb 03 22:15:56 2023
...
Mapped local pools from /path/to/config/databases:
  /ords/                              => default                        => VALID


2023-02-03T22:16:12.660Z INFO        Oracle REST Data Services initialized
Oracle REST Data Services version : 22.4.3.r0331239
Oracle REST Data Services server info: jetty/10.0.12
Oracle REST Data Services java info: Java HotSpot(TM) 64-Bit Server VM 11.0.13+10-LTS-370
As shown earlier, that applies to application/json responses such as for ORDS REST Services. It also applies to text/html responses for ORDS PL/SQL Gateway and even static content such as the APEX images.
Browser showing compressed content returned for static content such as style sheets.
Conclusion
This article has focused on ORDS in standalone mode and configuring the embedded Eclipse Jetty server instance. Similar compression options can be configured when ORDS is deployed on Apache Tomcat or Oracle WebLogic Server but the settings will be specific to those containers. Check their product documentation for information on how to configure that. The above Eclipse Jetty extension example is only applicable to ORDS standalone mode.
To reiterate, choosing the right compression configuration is important. It will take time, as well as monitoring of the additional resources involved. There may be specific paths where compression is too costly or the GZipHandler interferes with the successful processing of the response.
However, when using compression one should see benefits that include faster page loading times, improved user experience, and reduced bandwidth usage, all of which can help to improve overall performance of your ORDS based web application. Now that you know how, go make efficient use of your bandwidth!
Free and open source software (FOSS) has become an integral part of our lives. For those of us developing, hosting or supporting software applications anyway. Whether it’s a web server, a database, or a programming language, open source software is everywhere. That could be a single jar or javascript library, a framework, a utility or an entire software stack. It is hard to avoid it. Sometimes the free and open source option is the reference implementation for a specification which has a commercial alternative but it can be difficult to justify the cost of paying for that software. More often then not, one can find that modern commercial software systems are built with, or rely on, some form of free and open source software. It’s no surprise, considering all the benefits that come with it. Here are just a few reasons why it makes sense to use FOSS.
The case for free and open source
The reasons for choosing free and open source are compelling.
First and foremost, FOSS is free. This means that you don’t have to pay for a license or subscription, which can be a huge cost savings. It also means that you don’t have to worry about license renewals or updates. All of the software is available for free and can be used indefinitely.
Second, FOSS is open source, which means that anyone can view and modify the code. This makes it easier for developers to customise the software to meet their needs, and it can be a great way to learn programming.
Third, FOSS is typically more secure than proprietary software. The code is open, so any potential security vulnerabilities can be identified and fixed quickly. Additionally, many of these programs are built by volunteers and have a large community of users who can help identify and fix bugs.
Finally, and slightly similar to the previous point, FOSS can have a faster turnaround of fixes than proprietary software. Since the code is open, developers are more likely to fix bugs and make improvements more quickly. This can mean fewer interruptions to your workflow.
Overall, free and open source software makes a lot of sense for individuals and businesses alike. With so many benefits, it’s easy to see why FOSS has become so popular.
Hidden costs to the convenience
Complex systems involve a lot of components which need to be maintained
Unfortunately, many people are not aware of the importance of upgrading their open source software. Upgrading the components of the system is essential for keeping your system secure, stable, and up to date. Over time, vulnerabilities are discovered in software packages and the only way to fix these vulnerabilities is to upgrade to the latest version. By not upgrading, you are essentially leaving your system open to malicious attacks. You are not taking advantage of a core FOSS benefit.
As outlined earlier, upgrading to the latest version of a software component can give you access to bug fixes and performance enhancements that make your system more reliable and efficient. Furthermore, new features can be added to software packages to make them even more powerful and useful. Finally, upgrading open source software can help you stay ahead of the competition. By keeping your software up to date, you can ensure that you are using the latest technologies and staying ahead of the curve. This can help you gain an edge over your competitors and give you a competitive advantage. In conclusion, upgrading open source software is essential for keeping your system secure, stable, and up to date. It also can give you access to bug fixes, performance enhancements, and new features. Finally, it can help you stay ahead of the competition and give you a competitive advantage. So make sure you keep your open source software up to date!
Oracle REST Data Services does rely on components from third parties including FOSS components and critical vulnerabilities and exploits are regularly monitored for known issues that would require an upgrade. Not only that, keeping on top of the security support commitments for those libraries. That is one of the reasons ORDS moved to Eclipse Jetty 10 last year. When a new version of ORDS is available, it is recommended to upgrade as soon as possible.
Why upgrade to Apache Tomcat 10.1 though?
With complex dependencies an upgrade is not always easy
Upgrading is easier said than done though. The interdependencies of the components in a software system can be quite complex. Upgrading to the latest version of one component could cause another component to no longer work. There is a tension between trying to keep existing systems running, introduce new applications / functionality and reduce complexity / costs in the runtime environment.
Which sets the scene for why we’re discussing Apache Tomcat 10.1. Why would someone want to use Apache Tomcat 10.1?
Support considerations
We can expect Tomcat versions released after 2007 to have around 10 years of support before they reach end of life. Tomcat 7, for example, was released in 2011 and reached end of life in 2021. Tomcat 9.0 was released in 2017 and declared stable in 2018. At the time of writing, version 9.0.71 was released earlier this month. No end of life date has been specified but one can expect it to be around 2027. With five years to go for new releases with fixes to bugs and security vulnerabilities there’s no pressing need to move off Tomcat 9.0. However, with Tomcat 8.5 scheduled for EOL at the end of March 2024 anyone currently using Tomcat 8.5 in production would be considering the stable release with the longest runway: Tomcat 10.1.
Jakarta
At this point you’ll note that Tomcat 10.0 does not get a mention. It has already reached it’s EOL and no further builds for that particular release will happen, irrespective of any CVE reported against it. The most likely motivation for moving to Tomcat 10.1 is because it is a Jakarta EE platform. It builds on Tomcat 10.0.x and implements the Servlet 6.0, JSP 3.1, EL 5.0, WebSocket 2.1 and Authentication 3.0 specifications (the versions required by Jakarta EE 10 platform). For businesses or individuals that deploy multiple applications there may be a conflict with wanting to use Jakarta Servlet API based web applications in the same infrastructure they have Javax Servlet API based web applications. The main difference between Javax Servlet API and Jakarta Servlet API is the addition of new features in the Jakarta version. Jakarta Servlet API adds features such as asynchronous servlet requests, Non-blocking IO, improved security, and better integration with other Jakarta EE APIs. Having one single version of Apache Tomcat to maintain would be preferable.
ORDS running on Apache Tomcat 10.1
Your Jakarta Servlet API based applications and ORDS on the same Apache Tomcat 10.1 ! Photo by Christina Morillo on Pexels.com
ORDS is a web application based on the Javax Servlet API and as such can not be deployed as a regular web application in Tomcat 10.1 which expects web applications to be implemented using Jakarta Servlet API. Thankfully, Apache has provided a comprehensive migration guide to help make transitioning from any version of Tomcat 9 to Tomcat 10 as simple as possible. In addition to that, there is a migration utility which converts the java byte code of the javax.servlet.HttpServlet classes to jakarta.servlet.http.HttpServlet classes. This is really useful because it makes it possible to deploy the generated ords.war using the Apache Tomcat migration tool for Jakarta EE. https://tomcat.apache.org/migration-10.html#Specification_APIs
Referring to the Deploying ORDS on Apache Tomcat instructions it is simply a matter of generating the ords.war to the correct location:
ords --config /path/to/config war $CATALINA_HOME/webapps-javaee/ords.war
It really is as simple as that. This article was originally going to be a step by step guide but when you get down to it, there’s only one step!
Strictly speaking, Apache Tomcat 10.1 is not an officially supported release of Tomcat for deploying ORDS. At the time of writing it is Tomcat release 8.5.x through to release 9.0.x. Therefore, if there are any ORDS issues encountered the first thing you’ll be asked to do is see does the same issue occur with latest version of ORDS deployed on a recent Tomcat 9.0.x release.
Use of the Apache Tomcat migration tool for Jakarta EE to have ORDS running on Apache Tomcat 10.1 is worth considering if one has Jakarta Servlet API based web applications to deploy and only want a single version of Tomcat running.
Are you looking for an effective way to monitor the performance of your Oracle REST Data Services deployments? ORDS provides a RESTful interface for Oracle databases. It allows you to access and manipulate data stored in Oracle databases in a secure and efficient manner. That efficiency depends on a multitude of factors. There is a reason you will not find any documented guidance on sizing of JVM memory, garbage collection, or UCP pool size. The appropriate settings are unique to the real world scenarios that the product will be used in. The optimum settings will be different from customer to customer, workload to workload. For most customers the defaults will probably be just fine. As their workload increases, with more concurrent clients, spinning up an additional ORDS instance in their cluster is generally the only change in the deployment topology. Slow response times are generally due to inefficient queries rather than not allocating heap space or the number of CPUs available.
What if you want to delve into the usage of computing resources when ORDS is running? Oracle Application Process Monitoring (Oracle APM) can help you get the job done. It is an enterprise-grade monitoring solution designed to help you identify, analyse, and troubleshoot performance issues in your applications. When you use ORDS with Oracle APM, you can monitor the performance of your deployment in real-time, allowing you to make informed decisions about where and when to make performance tuning changes to the topology. Oracle APM is available as part of the Oracle Cloud Observability and Management Platform. Many of the services and resources require an upgrade to a paid OCI account but the focus here will be on what can be achieved with the Oracle APM services using OCI Free Tier.
Use the preconfigured Application Server dashboard to determine if resource limits are being hit
Overview
In this article we will go over the steps for setting up Oracle APM and using the Oracle APM Java Agent with ORDS 22.4.0 deployed on an Apache Tomcat 9.0.56 server. Oracle APM supports various deployment topologies including Apache Tomcat, Oracle WebLogic Server and in OCI comes with a preconfigured Application Server dashboard.
Although the Oracle APM services are hosted in Oracle Cloud the Oracle APM Java Agent can be used anywhere. In this scenario Oracle APM is used from the OCI Frankfurt region but the Apache Tomcat server running ORDS 22.4.0 is running on-premise. The process for deploying ORDS on Tomcat is already well documented so this article will focus on the Oracle APM aspects.
The steps outlined below are based on Provision and Deploy APM Java Agents on Application Servers but do not follow it to the letter. For further details and more in depth explanation of the process you should refer to that documentation.
Oracle APM is a service in OCI Observability & Management
Create your APM Domain
The APM Domain specifies the Data Upload Endpoint and keys for the APM Java Agent to use at runtime.
The APM Domain is the key resource for using Oracle APM. The domain contains important configuration information about what data is stored and for how long. Follow these steps to create a Free Tier domain. Note that with Free Tier there are limits in place. In the above screenshot you can see that an APM Domain called ORDS has been created. You can use whatever name is suitable for your environment.
Take note of the Data Upload Endpoint and the Private Data Key. You’ll need them when provisioning the APM Java Agent instance which will be used with the Apache Tomcat server later.
Provision the agent
Provisioning the agent is the process of defining the specific properties for a Java Agent instance to be used with a specific Java application at runtime. In this case the Java application is Apache Tomcat which will have an ORDS web application deployed to it. If there were more than one Apache Tomcat server then a Java Agent would have to be provisioned for each. The provisioning process creates a directory containing jars, configuration log directories which will be used at runtime.
In this case the directory will be ~/work/ora_apm but you can use a directory that makes sense for you. The Oracle APM documentation does suggest using a directory where your application server is installed. For example the $CATALINA_HOME for your Apache Tomcat server but in this case a separate directory is used just to keep the APM configuration separate from the Tomcat configuration.
Before we do that, the Java Agent installer must first be downloaded.
Find the download link in the Administration section.
Once downloaded run the installer to provision the Java Agent. Here the server name is specified as ords_1 but that’s just to identify which Java Application is pushing the metrics to Oracle APM. It could be whatever value makes sense for your environment.
That creates a ApmAgentInstall.log file and oracle-apm-agent directory in ~/work/ora_apm. Your provisioned Java Agent, including jar files and configuration details, is in the oracle-apm-agent directory.
Start Apache Tomcat
Now that you have a Java Agent it can be specified when starting Apache Tomcat. In this environment the Apache Tomcat installation is at ~/work/apache/tomcat/9.0.56/. The Oracle APM documented steps for deploying to Apache Tomcat does outline steps for modifying the catalina.sh script. That’s the best thing to do so that the Java Agent is applied every time Tomcat starts. However, in this case the JAVA_OPTS environment variable will be used. When specifying the javaagent parameter the full directory path must be used.
export JAVA_OPTS="-javaagent:~/work/ora_apm/oracle-apm-agent/bootstrap/ApmAgent.jar"
~/work/apache/tomcat/9.0.56/bin/catalina.sh start

Using CATALINA_BASE:   /Users/peobrie/work/apache/tomcat/9.0.56
Using CATALINA_HOME:   /Users/peobrie/work/apache/tomcat/9.0.56
Using CATALINA_TMPDIR: /Users/peobrie/work/apache/tomcat/9.0.56/temp
Using JRE_HOME:        /Library/Java/JavaVirtualMachines/jdk-11.0.13.jdk/Contents/Home
Using CLASSPATH:       /Users/peobrie/work/apache/tomcat/9.0.56/bin/bootstrap.jar:/Users/peobrie/work/apache/tomcat/9.0.56/bin/tomcat-juli.jar
Using CATALINA_OPTS:
Tomcat started.
Apache Tomcat log shows Oracle APM and ORDs startup output
Monitor performance
Once Tomcat is up and running, you can begin monitoring application performance. This can be done using the APM console, or by setting up custom dashboards and alerts. The later features only available if you have upgraded to a paid OCI account. Time to review what metric information has been sent to Oracle APM data upload endpoint for your domain.
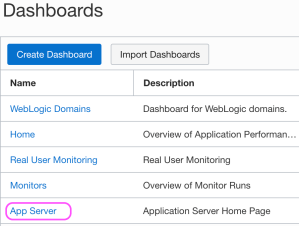
Navigate to the Dashboards page
Choose the Application Server Dashboard
The Oracle-defined dashboards are listed on the Dashboards page. When a dashboard is initially selected one must specify the following details:
Select the compartment in which your APM domain resides. Note that if a compartment is selected on the Dashboards page, then it’s displayed by default.
Select the APM domain that contains the systems being monitored by Application Performance Monitoring.
Select the resource that you want to monitor. For example, in the App Server dashboard, select an application server in the App Server drop-down list.
Select the time period for which you want data to be populated in the dashboard.
The App Server dropdown values will correspond to the Apache Tomcat server that the Oracle APM Java Agent is being used with. After you specify the details, the dashboards are populated with data and provide a quick insight into the health and performance of your application and enable you to identify the area that requires your attention.
The Oracle-defined dashboards, including the default Home dashboard will include information on metrics and APM resources which are not available in the Free Tier account. In this article we focus on the App Server dashboard.
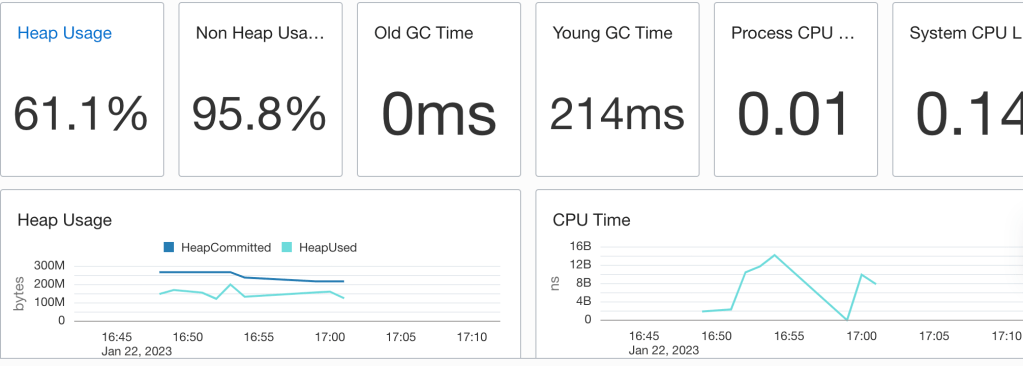
The App Server dashboard is the Home page for your application servers and enables you to analyse the resources used by your application servers and understand resource constraints and requirements. For instance, you can monitor this dashboard to analyse the heap and CPU usage of your application server.
No performance issues highlighted
In the above example heap used does get close to the heap committed so there may be some tuning to apply. One could apply some Java Performance Tuning options there to optimise for throughput, faster response times or just memory footprint. Note that the CPU load is quite low which suggests that there’s no need for additional ORDS instances.
But wait, there’s more
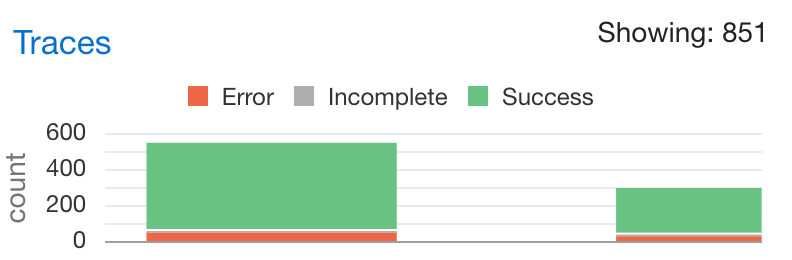
Not only do you have information on the resource usage of the Java application but there’s also tracing information on the requests received by ORDS. Moreover, that has a breakdown on time spend executing SQL queries and that can be really useful when optimising services. For example, running a SELECT on a table which is REST Enabled could take longer than necessary if there are a lot of columns. In some cases, a custom query to just return the data needed, using indexed columns, may the correct solution. This information is in the Oracle APM Trace Explorer. The restriction of the OCI Free Tier is that one can only have 1000 traces an hour so not all metrics for all requests are persisted.
Explore the trace data for requestsTracing data on the AutoREST service for EMPLOYEES table
The options for tracing services will be explored in a later article. Those on the Free Tier will benefit from reviewing them but will only have a small snapshot of the metrics and diagnostics data.
Conclusion
In this brief overview, you have seen the configuration and use of Oracle APM with ORDS ( and it could be any web application for that matter ) deployed on Apache Tomcat. Even in the Free Tier, with the hosted Oracle APM services provide a great performance insight option for anyone on a budget.
April 2024 Update !
Standalone mode was not mentioned in this article due to a Java Agent / Classloader issue. ORDS 24.1.0 no longer has this issue.
Use ORDS 24.1.0 or a later version.