
Are you looking for an effective way to monitor the performance of your Oracle REST Data Services deployments? ORDS provides a RESTful interface for Oracle databases. It allows you to access and manipulate data stored in Oracle databases in a secure and efficient manner. That efficiency depends on a multitude of factors. There is a reason you will not find any documented guidance on sizing of JVM memory, garbage collection, or UCP pool size. The appropriate settings are unique to the real world scenarios that the product will be used in. The optimum settings will be different from customer to customer, workload to workload. For most customers the defaults will probably be just fine. As their workload increases, with more concurrent clients, spinning up an additional ORDS instance in their cluster is generally the only change in the deployment topology. Slow response times are generally due to inefficient queries rather than not allocating heap space or the number of CPUs available.
What if you want to delve into the usage of computing resources when ORDS is running? Oracle Application Process Monitoring (Oracle APM) can help you get the job done. It is an enterprise-grade monitoring solution designed to help you identify, analyse, and troubleshoot performance issues in your applications. When you use ORDS with Oracle APM, you can monitor the performance of your deployment in real-time, allowing you to make informed decisions about where and when to make performance tuning changes to the topology. Oracle APM is available as part of the Oracle Cloud Observability and Management Platform. Many of the services and resources require an upgrade to a paid OCI account but the focus here will be on what can be achieved with the Oracle APM services using OCI Free Tier.

Overview
In this article we will go over the steps for setting up Oracle APM and using the Oracle APM Java Agent with ORDS 22.4.0 deployed on an Apache Tomcat 9.0.56 server. Oracle APM supports various deployment topologies including Apache Tomcat, Oracle WebLogic Server and in OCI comes with a preconfigured Application Server dashboard.
Although the Oracle APM services are hosted in Oracle Cloud the Oracle APM Java Agent can be used anywhere. In this scenario Oracle APM is used from the OCI Frankfurt region but the Apache Tomcat server running ORDS 22.4.0 is running on-premise. The process for deploying ORDS on Tomcat is already well documented so this article will focus on the Oracle APM aspects.
The steps outlined below are based on Provision and Deploy APM Java Agents on Application Servers but do not follow it to the letter. For further details and more in depth explanation of the process you should refer to that documentation.

Create your APM Domain

The APM Domain is the key resource for using Oracle APM. The domain contains important configuration information about what data is stored and for how long. Follow these steps to create a Free Tier domain. Note that with Free Tier there are limits in place. In the above screenshot you can see that an APM Domain called ORDS has been created. You can use whatever name is suitable for your environment.
Take note of the Data Upload Endpoint and the Private Data Key. You’ll need them when provisioning the APM Java Agent instance which will be used with the Apache Tomcat server later.
Provision the agent
Provisioning the agent is the process of defining the specific properties for a Java Agent instance to be used with a specific Java application at runtime. In this case the Java application is Apache Tomcat which will have an ORDS web application deployed to it. If there were more than one Apache Tomcat server then a Java Agent would have to be provisioned for each. The provisioning process creates a directory containing jars, configuration log directories which will be used at runtime.
In this case the directory will be ~/work/ora_apm but you can use a directory that makes sense for you. The Oracle APM documentation does suggest using a directory where your application server is installed. For example the $CATALINA_HOME for your Apache Tomcat server but in this case a separate directory is used just to keep the APM configuration separate from the Tomcat configuration.
Before we do that, the Java Agent installer must first be downloaded.

Once downloaded run the installer to provision the Java Agent. Here the server name is specified as ords_1 but that’s just to identify which Java Application is pushing the metrics to Oracle APM. It could be whatever value makes sense for your environment.
java -jar ~/Downloads/apm-java-agent-installer-1.8.3326.jar provision-agent -service-name=ords_1 -destination=~/work/ora_apm -private-data-key=AAA5UN2C6YOWWWUZ5Q7UUU3QACF4BBB -data-upload-endpoint=https://aaaaaaaaaaaaaaaaaaaa.apm-agt.eu-frankfurt-1.oci.oraclecloud.com
That creates a ApmAgentInstall.log file and oracle-apm-agent directory in ~/work/ora_apm. Your provisioned Java Agent, including jar files and configuration details, is in the oracle-apm-agent directory.
Start Apache Tomcat
Now that you have a Java Agent it can be specified when starting Apache Tomcat. In this environment the Apache Tomcat installation is at ~/work/apache/tomcat/9.0.56/. The Oracle APM documented steps for deploying to Apache Tomcat does outline steps for modifying the catalina.sh script. That’s the best thing to do so that the Java Agent is applied every time Tomcat starts. However, in this case the JAVA_OPTS environment variable will be used. When specifying the javaagent parameter the full directory path must be used.
export JAVA_OPTS="-javaagent:~/work/ora_apm/oracle-apm-agent/bootstrap/ApmAgent.jar"
~/work/apache/tomcat/9.0.56/bin/catalina.sh start

Using CATALINA_BASE:   /Users/peobrie/work/apache/tomcat/9.0.56
Using CATALINA_HOME:   /Users/peobrie/work/apache/tomcat/9.0.56
Using CATALINA_TMPDIR: /Users/peobrie/work/apache/tomcat/9.0.56/temp
Using JRE_HOME:        /Library/Java/JavaVirtualMachines/jdk-11.0.13.jdk/Contents/Home
Using CLASSPATH:       /Users/peobrie/work/apache/tomcat/9.0.56/bin/bootstrap.jar:/Users/peobrie/work/apache/tomcat/9.0.56/bin/tomcat-juli.jar
Using CATALINA_OPTS:
Tomcat started.

Monitor performance
Once Tomcat is up and running, you can begin monitoring application performance. This can be done using the APM console, or by setting up custom dashboards and alerts. The later features only available if you have upgraded to a paid OCI account. Time to review what metric information has been sent to Oracle APM data upload endpoint for your domain.

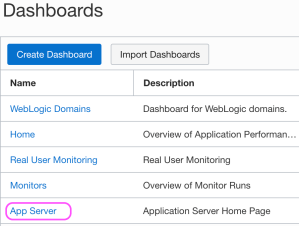
The Oracle-defined dashboards are listed on the Dashboards page. When a dashboard is initially selected one must specify the following details:
- Select the compartment in which your APM domain resides. Note that if a compartment is selected on the Dashboards page, then it’s displayed by default.
- Select the APM domain that contains the systems being monitored by Application Performance Monitoring.
- Select the resource that you want to monitor. For example, in the App Server dashboard, select an application server in the App Server drop-down list.
- Select the time period for which you want data to be populated in the dashboard.
The App Server dropdown values will correspond to the Apache Tomcat server that the Oracle APM Java Agent is being used with. After you specify the details, the dashboards are populated with data and provide a quick insight into the health and performance of your application and enable you to identify the area that requires your attention.
The Oracle-defined dashboards, including the default Home dashboard will include information on metrics and APM resources which are not available in the Free Tier account. In this article we focus on the App Server dashboard.
The App Server dashboard is the Home page for your application servers and enables you to analyse the resources used by your application servers and understand resource constraints and requirements. For instance, you can monitor this dashboard to analyse the heap and CPU usage of your application server.
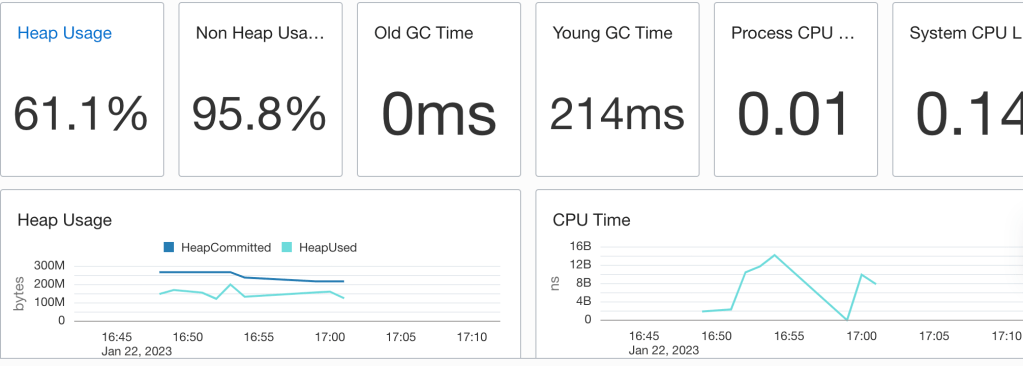
In the above example heap used does get close to the heap committed so there may be some tuning to apply. One could apply some Java Performance Tuning options there to optimise for throughput, faster response times or just memory footprint. Note that the CPU load is quite low which suggests that there’s no need for additional ORDS instances.
But wait, there’s more
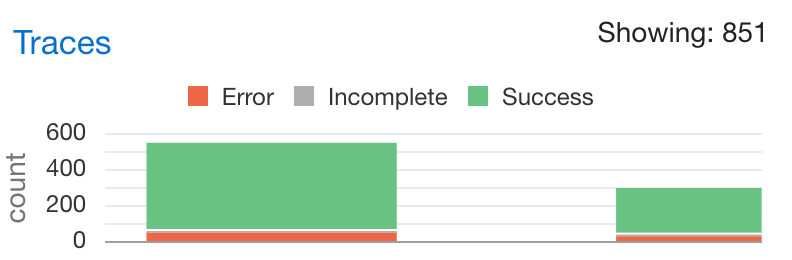
Not only do you have information on the resource usage of the Java application but there’s also tracing information on the requests received by ORDS. Moreover, that has a breakdown on time spend executing SQL queries and that can be really useful when optimising services. For example, running a SELECT on a table which is REST Enabled could take longer than necessary if there are a lot of columns. In some cases, a custom query to just return the data needed, using indexed columns, may the correct solution. This information is in the Oracle APM Trace Explorer. The restriction of the OCI Free Tier is that one can only have 1000 traces an hour so not all metrics for all requests are persisted.

The options for tracing services will be explored in a later article. Those on the Free Tier will benefit from reviewing them but will only have a small snapshot of the metrics and diagnostics data.
Conclusion
In this brief overview, you have seen the configuration and use of Oracle APM with ORDS ( and it could be any web application for that matter ) deployed on Apache Tomcat. Even in the Free Tier, with the hosted Oracle APM services provide a great performance insight option for anyone on a budget.
April 2024 Update !
Standalone mode was not mentioned in this article due to a Java Agent / Classloader issue. ORDS 24.1.0 no longer has this issue.
Use ORDS 24.1.0 or a later version.
To get a more detailed understanding of what Oracle APM could do for you take some time to go through the article announcing it’s general availability. It’s powerful stuff.

3 thoughts on “Optimise Java settings with Application Process Monitoring”