This article is part of a series about using ORDS on Docker with NGINX, SSL and Oracle Autonomous Database. The previous article is Load Balancing ORDS with NGINX which introduced the concept of load balancing and the most basic of configurations to get started with NGINX running in docker. That was entirely using HTTP as the transport protocol.
Around this time two years ago, in the Load Balancing ORDS with NGINX article, I covered what was certainly the quickest way to spin up a load balancer in front of your ORDS instances: NGINX with Load Balancing configuration and docker official NGINX image. It’s time to build on that to configure the load balancer for HTTPS traffic and to demonstrate that not only is a round robin routing policy in place but also the desired failover / recovery when an ORDS instance is stopped and started.
In this article I will go through the steps of generating a self signed certificate so that HTTPS traffic can be encrypted. Then I will walk through the configuration of NGINX to receive requests over HTTPS and distribute those requests to ORDS instances running on the same machine which accept unencrypted traffic. The first thing we need are two ORDS instances configured for the same database.
ORDS Instances
In this example there is one database and two ORDS instances running in standalone mode on different ports. Both ORDS instances will be sharing the same configuration directory. The configuration directory not only contains the pool and global settings but the global/doc_root directory contains the APEX image files that are required for Oracle APEX to operate. It is recommended to use the APEX CDN where possible but in this case the files have been downloaded and extract from apex.oracle.com.
/path/to/config/ directory structure
|
|-databases/
|    |-default/
|        |-pool.xml
|-global/
     |-doc_root/
     |   |-i/
     |      |-apex_version.txt
     |      |-etc.
     |-settings.xml
The configuration is fairly standard but there are two important configuration settings needed so that the ORDS instances will accept requests from the load balancer over HTTP even though the load balancer is receiving the requests over HTTPS. These settings are security.httpsHeaderCheck and security.externalSessionTrustedOrigins.
~/Downloads/ords-22.4.3.033.1239/bin/ords --config /path/to/config config set security.httpsHeaderCheck "X-Forwarded-Proto: https"

~/Downloads/ords-22.4.3.033.1239/bin/ords --config /path/to/config config set security.externalSessionTrustedOrigins "https://ords.example.com"
You’ll notice that the most recent released version of ORDS is being used from the downloads directory that it was extracted to. Of course you are free to download and run ORDS in whatever directory makes sense for your system.
The security.httpsHeaderCheck setting tells ORDS what header, and value, to look for to confirm that the load balancer received the request over HTTPS. The security.externalSessionTrustedOrigins setting tells ORDS that requests with these Origin values can be trusted in a secured context.
The ORDS instances are started in two separate terminal windows relying on 8080 to be the default port for one and specifying 8090 as the port for the second instances.
~/Downloads/ords-22.4.3.033.1239/bin/ords --config /path/to/config serve
...
Configuration:
  /path/to/config

INFO        HTTP and HTTP/2 cleartext listening on host: 0.0.0.0 port: 8080
INFO        The document root is serving static resources located in: /path/to/config/global/doc_root
...
INFO        Oracle REST Data Services initialized
Oracle REST Data Services version : 22.4.3.r0331239
Oracle REST Data Services server info: jetty/10.0.12
Oracle REST Data Services java info: Java HotSpot(TM) 64-Bit Server VM 11.0.13+10-LTS-370
That ORDS instance can be verified to be accessible using http://localhost:8080/ords/
~/Downloads/ords-22.4.3.033.1239/bin/ords --config /path/to/config serve --port 8090

...
Configuration:
  /path/to/config

INFO        HTTP and HTTP/2 cleartext listening on host: 0.0.0.0 port: 8090
INFO        The document root is serving static resources located in: /path/to/config/global/doc_root
...
INFO        Oracle REST Data Services initialized
Oracle REST Data Services version : 22.4.3.r0331239
Oracle REST Data Services server info: jetty/10.0.12
Oracle REST Data Services java info: Java HotSpot(TM) 64-Bit Server VM 11.0.13+10-LTS-370
That ORDS instance can be verified to be accessible using http://localhost:8090/ords/
A word about folder structure
There are going to be files involved in this exercise and instead of repeating which files are where I’ll outline the folder structure for the nginx configuration here. Everything is going to exist under a directory called ords-nginx in the user home directory.
~/ords-nginx/ directory structure
|
|-nginx.conf <- configuration file
|-certs/
     |-nginx.crt <- certificate for the domain
     |-nginx.key <- RSA private key
Certificate for HTTPS

A certificate is required for HTTPS to make sure that the website you are visiting is secure. Secure in this context means that the data sent between client and website is not intercepted by malicious actors. Without the certificate, the website would not be secure, and any data sent between the website and the user could be compromised. In general, certificates are issued by Certificate Authorities ( CA) that are trusted by most browsers. In this article, for convenience, we’ll use a self signed certificate rather than one issued by a CA.
A self-signed SSL certificate is an identity certificate that is signed and issued by the same entity that is using it. It is used to secure a network connection between two or more systems and is used to prove the identity of a server or website. Self-signed SSL certificates are free to generate, but they are not trusted by web browsers and other clients, so they are not recommended for use on public websites. They are, however, useful for internal networks, where trust is already established.
The certificate Common Name attribute corresponds to the website address. Typically there would be a domain name service ( DNS ) which resolves that name to a specific IP address and server. In this article I’m taking a short cut and not using a DNS but rather telling my machine that ords.example.com is actually the local IP address 127.0.0.1. There are other options such as Dnsmasq that can make defining a custom domain name in your network a bit easier. For now, I have an entry in /etc/hosts that looks like this:
##
# Host Database
#
# localhost is used to configure the loopback interface
# when the system is booting.  Do not change this entry.
##
127.0.0.1	localhost
127.0.0.1       ords.example.com
When I send a request to https://ords.example.com/ it will be routed to the 127.0.0.1 loopback address. Now that little bit of network traffic configuration is in place it’s time to create a self signed certificate for the ords.example.com host name. Browsers will report the self signed certificate as Not Secure because it can not be verified with a trusted Certificate Authority, but the traffic will be encrypted.

Self Signed Certificate
A self signed certificate is a certificate that is not signed by a trusted Certificate Authority (CA) and is used for testing purposes or for applications that are only accessed within a trusted network. In other words, not accessed from the internet. If your goal is to have nginx as a load balancer accepting traffic from the public then after you have completed the setup in this article, replace the self signed certificates with a certificate for your domain which you have obtained from a CA.
To generate our self signed certificate for ords.example.com we’ll use openssl which is most likely already installed on your operating system. Open a terminal window, change your working directory to ~/ords-nginx/ and follow these steps to create a self signed certificate using openssl.
Generate a Private Key and Certificate
A public-private key pair is a set of two cryptographic keys, consisting of a public key and a private key. The public key is used for encryption and decryption, while the private key is used for signing and verification. Public keys are exchanged between two parties and can be used to encrypt data to be sent securely. Private keys are kept secret and are used to prove the identity of the sender. The two keys are mathematically related and are used together to establish a secure communication link.
Using openssl one can have separate distinct steps to generate a private key, generate a Certificate Signing Request and generate the certificate. We can also do all that with a single openssl command executed in the ~/ords-nginx/ directory:
> openssl req -x509 -nodes -days 365 \
              -newkey rsa:2048 \
              -keyout certs/nginx.key \
              -out certs/nginx.crt

Generating a 2048 bit RSA private key
.................................................+++++
....+++++
writing new private key to 'certs/nginx.key'
-----
You are about to be asked to enter information that will be incorporated
into your certificate request.
What you are about to enter is what is called a Distinguished Name or a DN.
There are quite a few fields but you can leave some blank
For some fields there will be a default value,
If you enter '.', the field will be left blank.
-----
Country Name (2 letter code) []:
State or Province Name (full name) []:
Locality Name (eg, city) []:
Organization Name (eg, company) []:
Organizational Unit Name (eg, section) []:
Common Name (eg, fully qualified host name) []:ords.example.com
Email Address []:
That will generate a 2048-bit RSA private key called nginx.key and a self signed certificate for the ords.example.com host name called nginx.crt. You will note that the majority of prompts are left empty and the only field that a value is entered for is Common Name. And that’s it! You have successfully created a self signed certificate using openssl and that certificate will remain valid for 365 days. You can now use this certificate with nginx.
NGINX
This section has two parts: create the configuration and run the nginx docker container with that configuration.
Configuration
Create the ~/ords-nginx/nginx.conf file as below. I will summarise what each line does but you should refer to nginx documentation for further details on the nginx configuration entries.
# No specific connection processing instructions
events {}

# The configuration for http(s) traffic
http {
# Log format to use for access log.
# This will show which server a request gets routed to.
    log_format upstreamlog '$server_name to: $upstream_addr {$request} '
   'upstream_response_time $upstream_response_time'
   ' request_time $request_time';

# List of servers to route to. Call that list 'ords'.
# Running in docker so host.docker.internal used to point to
# host machine which is running ORDS instances.
    upstream ords {
        server host.docker.internal:8080;
        server host.docker.internal:8090;
    }

# Configure a http server for port 80
# All requests are redirected to https
    server {
        listen 80 default_server;
        listen [::]:80 default_server;
        server_name _;
        return 301 https://$host$request_uri;
    }

# Configure a https server for port 443
    server {
        listen 443 ssl default_server;
        listen [::]:443 ssl default_server;
        ssl_certificate /etc/certs/nginx.crt;
        ssl_certificate_key /etc/certs/nginx.key;
# Specify the format to apply to access log
        access_log /var/log/nginx/access.log upstreamlog;
# Any requests get passed upstream to the 'ords' list
        location / {
            proxy_pass http://ords;
# Tells the upstream server what hostname the client used
            proxy_set_header Host $host;
# Tells the upstream server that https was used
            proxy_set_header X-Forwarded-Proto https;
        }
    }
}
The very first line is an empty events {} section. This is the section where directives that affect connection processing are specified. We have no particular connection processing needs beyond the default so it’s left empty. If we didn’t have this section here a [emerg] no “events” section in configuration message will appear in the logs.
The http section of the configuration has the important stuff. In that, as outlined by the above comments we have:
- An access log format which will include information on which upstream server a request is routed to. This will be useful later to confirm round-robin routing and seamless failover / recovery occurs.
- A list of servers to route traffic to. We have two in this example but it could be any number of ORDS instances.
- A server configuration to listen on port 80 but redirect all requests to use HTTPS and therefore port 443.
- A server configuration to list on port 443
- Specifies the file paths for the certificate and key files we generated earlier.
- Specifies the access log format to use.
- Specifies that for any location in the request URL the requested should be routed the ‘ords’ upstream servers.
- Irrespective of what the upstream server host name is, the Host header is set to whatever the client provided in the request. This is essential so that when ORDS must generated absolute URL values for a response the URL will be usable to the client.
- A header is set which corresponds to the ORDS configuration security.httpsHeaderCheck which was mentioned at the top of this article. This confirms to ORDS that although the upstream server received a request over HTTP, the load balancer received the request from the client over HTTPS.
Now that you have an NGINX configuration file it can be put to work.
Run
The ORDS instances are running in standalone mode, listening for HTTP requests on port 8080 and 8090 respectively. Let’s start NGINX in a docker container. While still in that ~/ords-nginx/ directory run the following:
docker run -p 80:80 -p 443:443 \
-v ${PWD}/nginx.conf:/etc/nginx/nginx.conf:ro \
-v ${PWD}/certs/:/etc/certs/:ro \
-d nginx
That will run NGINX in a docker container using the specific configuration as well as certificate and key files. Since the -d option is specified, the container is running in the background so the only output you will have seen is a long list of letters and numbers which is the container id. It will look like: 422598c154ee68db4ee6ffd3ed91e591fa19215539b3486517842f0ac47c6874
For a more human friendly way of referring to the container you can use the name which was automatically generated for it. You could run docker ps to get a list of the running containers and look for the nginx one or use docker inspect to get the container name.
> docker inspect 422598c154...c6874 \
         --format '{{.Name}}'

/epic_gates
Your container name will be different. The leading slash can be ignored. Let’s use that name to tail the docker container log.
> docker logs -f /epic_gates

docker logs -f /epic_gates
/docker-entrypoint.sh: /docker-entrypoint.d/ is not empty, will attempt to perform configuration
/docker-entrypoint.sh: Looking for shell scripts in /docker-entrypoint.d/
/docker-entrypoint.sh: Launching /docker-entrypoint.d/10-listen-on-ipv6-by-default.sh
10-listen-on-ipv6-by-default.sh: info: Getting the checksum of /etc/nginx/conf.d/default.conf
10-listen-on-ipv6-by-default.sh: info: Enabled listen on IPv6 in /etc/nginx/conf.d/default.conf
/docker-entrypoint.sh: Launching /docker-entrypoint.d/20-envsubst-on-templates.sh
/docker-entrypoint.sh: Launching /docker-entrypoint.d/30-tune-worker-processes.sh
/docker-entrypoint.sh: Configuration complete; ready for start up
Leave that tailing log open because we’re now going to use it to see the load balancer at work.
Try it out
This section is where the rubber hits the road. We’ll look at confirming round robin balancing, the redirect from HTTP to HTTPS, as well as the failover and recovery when upstream servers go down or come back up again.
Balancing act – round robin
Perform a simple test be running the following curl command twice:
> curl --head --insecure https://ords.example.com/ords/sql-developer

HTTP/1.1 200 OK
Server: nginx/1.23.3
Date: Sat, 11 Feb 2023 23:53:22 GMT
Content-Type: text/html
Connection: keep-alive
The response will indicate that you are talking to nginx and that the request was processed without error. Those curl command options are important. The --head option means that the request action is HEAD and not GET so there’s no body in the response to display and the --insecure option means do not verify the certificate that the server is using. The latter part is important because the certificate is not signed by any trusted CA. What’s significant at this stage is what shows up in the nginx log. See how there are two entries because we had two requests. One went to upstream server listening on port 8080 and the next request went to the next server. That’s round robin routing in action.
 to: 192.168.5.2:8080 {HEAD /ords/sql-developer HTTP/1.1} upstream_response_time 0.022 request_time 0.022
 to: 192.168.5.2:8090 {HEAD /ords/sql-developer HTTP/1.1} upstream_response_time 0.019 request_time 0.019
Forcing HTTPS
In the nginx.conf we have a server definition which redirects all HTTP traffic on port 80 to HTTPS on port 443. This can be verified very simply with a request to a HTTP.
> curl --insecure --include http://ords.example.com/ords/sql-developer
HTTP/1.1 301 Moved Permanently
Server: nginx/1.23.3
Date: Sun, 12 Feb 2023 00:07:51 GMT
Content-Type: text/html
Content-Length: 169
Connection: keep-alive
Location: https://ords.example.com/ords/sql-developer

<html>
<head><title>301 Moved Permanently</title></head>
<body>
<center><h1>301 Moved Permanently</h1></center>
<hr><center>nginx/1.23.3</center>
</body>
</html>
Failover and Recover
The load balancer can share the request processing load across upstream servers but that is not the only thing it brings to the party. When there is a new release of ORDS it would be great to have little, or even none what so ever, downtime while doing the upgrade. When one server is brought down, nginx will identify that it is no longer available and will seamless hand the request over to the next server. The load balancer will continue to check on all upstream servers and when a server is back online will proceed to route requests to it. Let’s take a look at that failover and recovery.
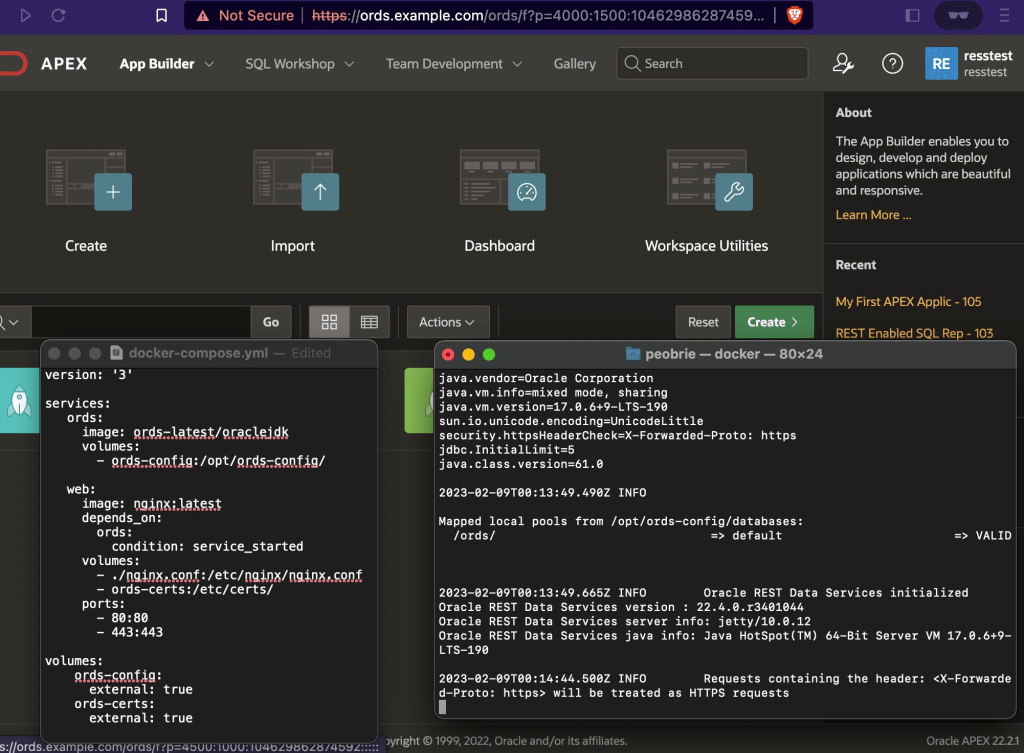
In this example I’ll use APEX (https://ords.example.com/ords/) but you could use SQL Developer Web (https://ords.example.com/ords/sql-developer) if your environment does not have an APEX installation.
Open a browser to https://ords.example.com/ords/ and if you have not done so already, acknowledge the browser’s warning about the self signed certificate and proceed to the page. Login to APEX and navigate through the dashboard. In the nginx docker container log you will see the requests being routed to upstream server ports 8080 and 8090.
to: 192.168.5.2:8080 {GET /ords/f?p=4050:9:13779192078464::::: HTTP/1.1} upstream_response_time 3.288 request_time 3.288
to: 192.168.5.2:8090 {GET /i/libraries/jquery-migrate/3.4.0/jquery-migrate-3.4.0.min.js?v=22.2.0 HTTP/1.1} upstream_response_time 0.008 request_time 0.008
to: 192.168.5.2:8080 {GET /i/libraries/apex/minified/widget.report.min.js?v=22.2.0 HTTP/1.1} upstream_response_time 0.004 request_time 0.005
to: 192.168.5.2:8090 {GET /i/libraries/oraclejet/12.1.3/js/libs/oj/v12.1.3/resources/nls/localeElements.js HTTP/1.1} upstream_response_time 0.010 request_time 0.009
to: 192.168.5.2:8080 {GET /i/apex_ui/img/favicons/favicon.ico HTTP/1.1} upstream_response_time 0.008 request_time 0.008
Now shutdown the ORDS instance that is listening on port 8080 but continue to navigate around APEX in the browser. Although no error displayed in the browser you will see an upstream routing failure mentioned in the logs and then handing that request over to the next upstream server. Then all subsequent requests only go to that upstream server listening on port 8090.
2023/02/09 22:30:49 [error] 30#30: *11 connect() failed (111: Connection refused) while connecting to upstream, client: 172.17.0.1, server: , request: "GET /i/libraries/jquery-migrate/3.4.0/jquery-migrate-3.4.0.min.js?v=22.2.0 HTTP/1.1", upstream: "http://192.168.5.2:8080/i/libraries/jquery-migrate/3.4.0/jquery-migrate-3.4.0.min.js?v=22.2.0", host: "ords.example.com", referrer: "https://ords.example.com/"
to: 192.168.5.2:8080, 192.168.5.2:8090 {GET /i/libraries/jquery-migrate/3.4.0/jquery-migrate-3.4.0.min.js?v=22.2.0 HTTP/1.1} upstream_response_time 0.001, 0.009 request_time 0.010
to: 192.168.5.2:8090 {GET /i/libraries/oraclejet/12.1.3/js/libs/oj/v12.1.3/resources/nls/localeElements.js HTTP/1.1} upstream_response_time 0.007 request_time 0.007
to: 192.168.5.2:8090 {GET /i/apex_ui/img/favicons/favicon.ico HTTP/1.1} upstream_response_time 0.007 request_time 0.007
to: 192.168.5.2:8090 {GET /ords/f?p=4050:115:13779192078464:::115,116,117:: HTTP/1.1} upstream_response_time 3.566 request_time 3.565
Bring the first ORDS server back up while continuing to use APEX in your browser and you’ll see it does not take long before we’re back to a round robin routing to both upstream servers.
to: 192.168.5.2:8090 {GET /ords/f?p=4050:9:13779192078464::::: HTTP/1.1} upstream_response_time 3.859 request_time 3.859
to: 192.168.5.2:8090 {GET /i/libraries/jquery-migrate/3.4.0/jquery-migrate-3.4.0.min.js?v=22.2.0 HTTP/1.1} upstream_response_time 0.008 request_time 0.009
to: 192.168.5.2:8080 {GET /i/libraries/apex/minified/widget.report.min.js?v=22.2.0 HTTP/1.1} upstream_response_time 0.082 request_time 0.082
to: 192.168.5.2:8090 {GET /i/libraries/oraclejet/12.1.3/js/libs/oj/v12.1.3/resources/nls/localeElements.js HTTP/1.1} upstream_response_time 0.005 request_time 0.005
to: 192.168.5.2:8080 {GET /i/apex_ui/img/favicons/favicon.ico HTTP/1.1} upstream_response_time 0.007 request_time 0.007
Trust me
The first time you point your browser to the https://ords.example.com there will be an error displayed because the certificate presented by nginx is self signed. Your browser is unable to verify the certificate and will display an ERR_CERT_AUTHORITY_INVALID message. However, since you know that you have generated the certificate yourself you can tell the browser to proceed.

The browser can also show you the information it has received from the certificate.

You can proceed to use ORDS through nginx with this certificate or arrange for a certificate issued by a certificate authority.
Conclusion
If you’ve gotten this far and followed the steps, you can now run a secure HTTPS load balancer in front of multiple ORDS instances. Congratulations!
As mentioned in a previous article about NGINX, those ORDS instances could be on Apache Tomcat, Oracle WebLogic Server and as shown in this article, ORDS standalone too.
These articles are part of a series that will cover taking advantage of containerised services for using ORDS in the most optimal, scalable and robust manner possible. Stay tuned.
The next article in this series Get started with Oracle REST Data Services (ORDS) and Docker will build on this NGINX configuration to show you how to quickly get started using ORDS and Docker. Together we will walk through the basics of building the Docker image, storing configuration in a Docker volume, running multiple ORDS instances and balancing the load using NGINX.