- Let’s come to an understanding…
- Java Database Connectivity (JDBC)
- REST Enabled SQL Export
- Secured REST Enabled view
- Further Reading and Resources
- Conclusion
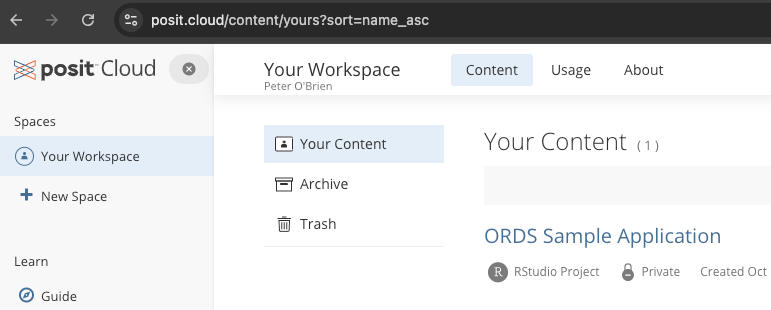
Now more than ever, data insights are crucial in driving informed decision-making and improving operational efficiency in the information age. The role of data science in uncovering these insights is more and more important, as it enables organisations to harness vast amounts of information effectively. In this article, I will showcase three ways to obtain concert event data from the Oracle REST Data Services (ORDS) Sample Application, stored in a hosted Autonomous Database, using R programming.
- Oracle JDBC
- REST Enable SQL Export
- Secured REST Enabled view
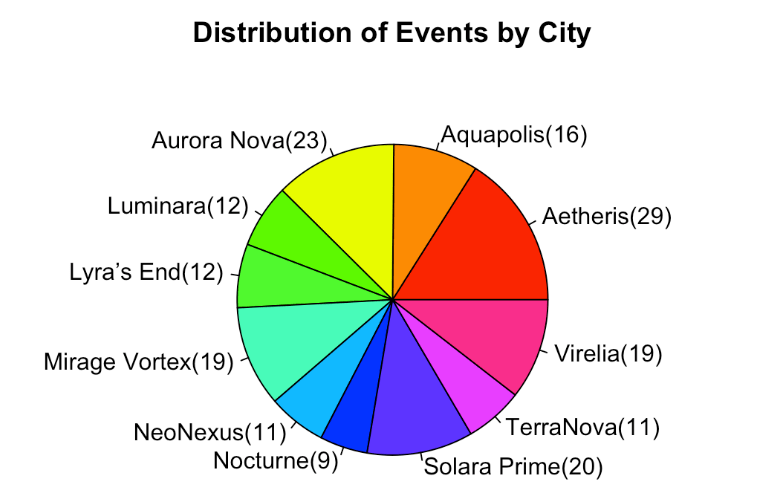
These approaches have pros and cons. In all three R scripts we go through the data retrieval process and use R’s capabilities for data analysis and visualisation. More specifically, we’ll have an R programming language script which loads live Sample Application event data from the Autonomous Database straight into the R environment and produce a pie chart of the number of events in each city.
Let’s come to an understanding…
Understanding R

R is a powerful programming language and environment specifically designed for statistical computing and data analysis. Widely used by data scientists, statisticians, and researchers, R offers a rich ecosystem of packages and libraries that facilitate a broad range of data manipulation, visualisation, and modelling tasks. Its syntax is intuitive, making it accessible for newcomers, while its flexibility allows advanced users to create custom solutions for complex analytical challenges. With strong support for data visualisation and robust statistical capabilities, R has become a go-to tool for transforming raw data into meaningful insights. Additionally, the active R community continuously contributes to its development, ensuring that users have access to the latest advancements in data science methodologies.
Most people programming with R will use RStudio. It provides cross platform consistency, a clean visual interface to the R environment and simplifies development steps ( automatically importing referenced libraries for example ). This article will assume you are running the provided R file in RStudio. Desktop IDE or hosted, the steps are the same.
Understanding Oracle REST Data Services (ORDS)

Oracle REST Data Services (ORDS) enables developers to easily expose Oracle Database data and functionality as RESTful web services. ORDS simplifies the process of building modern web applications by providing a straightforward interface for accessing database resources through standard HTTP methods.
Key Features of ORDS:
- RESTful APIs: Easily create and manage RESTful APIs for your Oracle Database objects.
- Integration with SQL, PL/SQL & JavaScript: Use SQL, PL/SQL or JavaScript directly within your APIs to access and manipulate data.
- Secure: With OAuth 2.0 integration there are multiple options for authentication and authorisation flows.
Understanding the ORDS Sample Application
The Oracle REST Data Services (ORDS) Sample Application serves as a practical demonstration of best practice in building scalable and secure applications using ORDS to expose Oracle Database functionality through RESTful APIs. Designed to help developers to understand ORDS capabilities, this sample application showcases how to define RESTful services securely and interact with them using modern web application development practices. Primarily react and remix in this case.
- React is a popular open-source JavaScript library developed by Facebook for building user interfaces, particularly for single-page applications.
- Remix, on the other hand, is a modern web framework built on top of React that focuses on providing an enhanced developer experience and performance.

The ORDS Sample Application functionally based around concert-related data, allowing users to subscribe to concerts, artists, and venues while providing administrators with tools to manage these entities. Jeff Smith provides a helpful overview in https://www.thatjeffsmith.com/archive/2024/10/typescript-remix-web-app-using-oracle-database-rest-apis/ along with a data model diagram of the tables involved.

Understanding OCI and the Autonomous Database
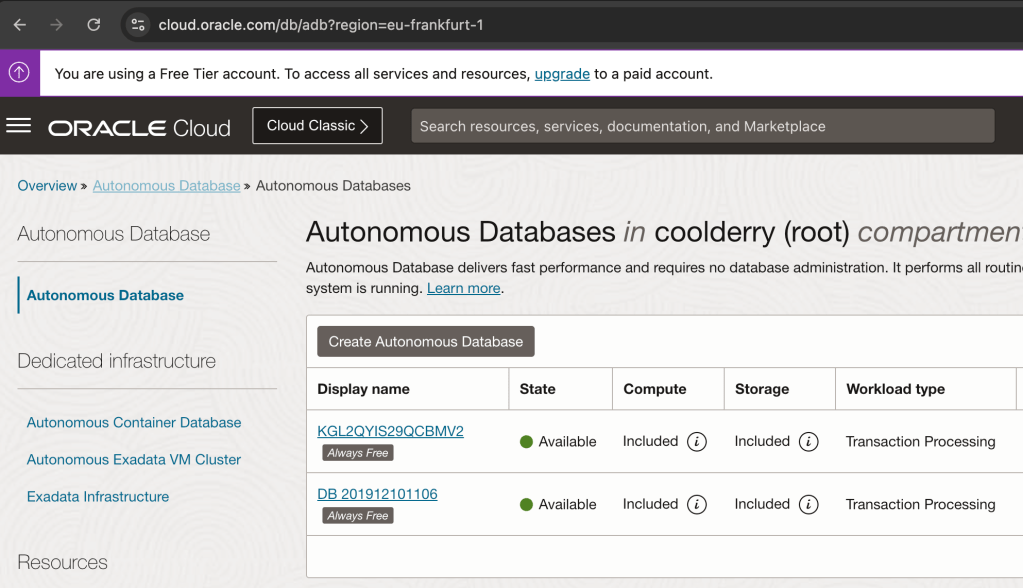
Oracle Cloud Infrastructure (OCI) is a comprehensive cloud platform that offers a range of services for building, running, and managing applications and databases. One of its standout offerings is the Autonomous Database (ADB), a self-driving, self-securing, and self-repairing database service designed to streamline data management. ADB automates routine tasks like patching, scaling, and tuning, allowing users to focus on data-driven synergies rather than maintenance. It comes in different flavours, such as Autonomous Data Warehouse (ADW) for analytics and Autonomous Transaction Processing (ATP) for transaction-based workloads. With built-in AI and machine learning capabilities, ADB optimises performance and enhances security, making it a robust choice for organisations looking to leverage the power of data with minimal manual intervention. Some of these features are premium but you can still do a lot with the Always Free services in OCI. One of the most significant features of the Autonomous Database is that each database comes with ORDS installed and ORDS servers managed and maintained by Oracle. All though you can run the ORDS Sample Application with any ORDS supported Oracle Database the ease of provisioning a database in OCI with ORDS ready to go makes the whole experience a breeze.
The OCI Free Tier is a way to try out Oracle Cloud Infrastructure (OCI) services without any cost. It gives you access to a set of free cloud resources that are available in two forms: Always Free services and Free Trial credits.
- Always Free Services: These are free forever and include services like Autonomous Database, Compute VMs, and Object Storage. You can use these to build and run small applications without worrying about costs.
- Free Trial Credits: When you sign up, you get a set amount of credits to try out any OCI service you want for 30 days. This lets you explore more powerful services and features before deciding if you want to upgrade.
With the OCI Free Tier, you can start experimenting with cloud computing, build projects, and learn how to use different tools and technologies without committing any money upfront.
Understanding the scripts
In this article I walk through the steps of using JDBC, REST Enabled SQL and REST Enabling a view to bring EVENTS_VIEW data into the R environment for analysis and data visualisation.
Each R script will end with the same set of instructions to show a summary of the data and generate a pie chart.
# Display the first few rows of the combined data
head(data)
# Summarize the data to count occurrences of each CITY_NAME
city_counts <- table(data$city_name)
# Create the pie chart
pie(city_counts,
    main = "Distribution of Events by City",
    col = rainbow(length(city_counts)),
    labels = paste(names(city_counts),
                   "(", city_counts, ")",
                   sep=""
                  )
   )
Another R function that you’ll see is askpass which prompts for a secret and does not hold the value as a variable which can be easily interrogated. And now, on with the 3 script options to produce the above chart…
Java Database Connectivity (JDBC)
Java Database Connectivity (JDBC) is a standard way for Java applications to connect to databases, run SQL queries, and get results. It works with different databases, making it a popular choice for accessing data. The more experienced R programmers at this stage will no doubt be thinking that JDBC is not the only horse at the races. There are already a few options for connecting to an Oracle Database and bringing data into an R environment. The commercial edition of RStudio provides a range of database connection packages. JDBC provides a free option which matches nicely with our Free Tier use of OCI.
Free: It’s the perfect price for my experimentation budget!
Although JDBC is designed for Java, you can also use it in R with the help of the RJDBC package. This package lets R connect to databases using JDBC drivers, allowing you to run SQL queries and bring the data into R for analysis.
Using JDBC in R
To connect to a database using JDBC in R, you need:
- JDBC Driver: A file (usually at least one
.jarbut more than one might be needed) that helps R talk to the database. - Connection String: A string that provides details on how to connect to the database, such as the database URL, port number, and credentials.
More specifically for the Autonomous Database you will need two JDBC related jars, the database wallet archive file extracted and the TNS name to reference in your connection string.
Let’s build that connection string first and let’s start with looking at the TNS Names for the various service levels available for your database. Since we’ll only be loading in data once we can use the low service. For more details on connection options to your Autonomous Database see https://docs.oracle.com/en-us/iaas/autonomous-database-serverless/doc/connect-preparing.html
Below are some screen shots of the Database connection information for my database in Frankfurt region. I’m going to show them backwards to explain some concepts. TNS name references an entry in a wallet that you will download, Mutual TLS requires a certificate that will also be in that wallet. There’s also some information to say you don’t really need to use Mutual TLS in all cases but it is a good practice and keeps your JDBC setup as simple as it can be.

All the details will be in the client wallet which I must download.

Once you have the TNS Name and the wallet file extracted to a directory your JDBC connection string is
jdbc:oracle:thin:<tns name>?TNS_ADMIN=<wallet directory>"
For example:
jdbc:oracle:thin:@db201912101106_low?TNS_ADMIN=/cloud/project/db201912101106
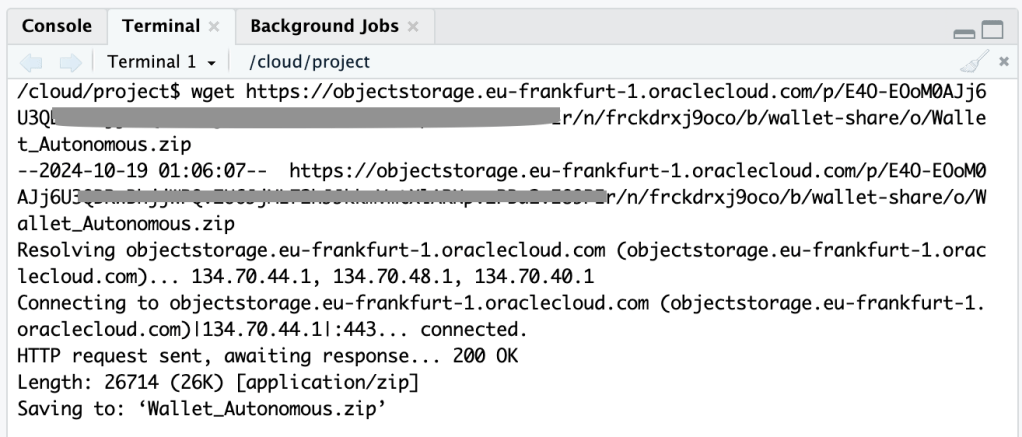
Just so I could run my script in the hosted RStudio on posit Cloud. I needed that wallet accessible there. To get the zip file there I went through a couple of hoops: upload to OCI object storage, create a PAR for the file, use that PAR to get the file and then extract it into a directory called /cloud/project/db201912101106 because db201912101106 just happens to be the autogenerated name of my database when I created back in 2019 and I haven’t changed it since.
Now that we have a connection string, what about the Oracle JDBC jar? The quickest way is to use wget again to just download the most recent version from Maven Central. See https://mvnrepository.com/artifact/com.oracle.database.jdbc/ojdbc11/23.5.0.24.07 for the jar URL. You’re going to need one more jar because of that wallet and Mutual TLS. Get the corresponding OraclePKI jar too.

Which now means you are ready to specify the correct JDBC Driver and Connection String for connecting to your database. For example:
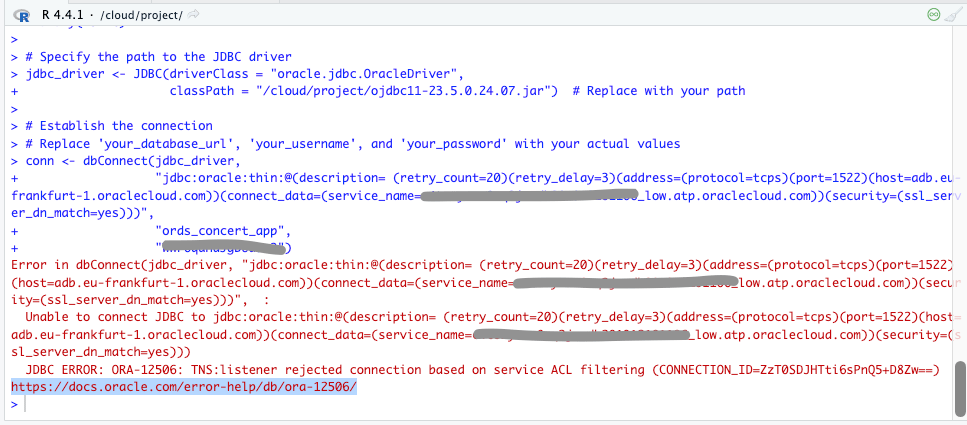
# Specify the path to the JDBC driver
jdbc_driver <- JDBC(driverClass = "oracle.jdbc.OracleDriver",
                    classPath = "/cloud/project/ojdbc11-23.5.0.24.07.jar:/cloud/project/oraclepki-23.5.0.24.07.jar")  # Replace with your path

username <- "ords_sample_app"

# Establish the connection
# Replace TNS Name and wallet location with your actual values
conn <- dbConnect(jdbc_driver,
                  "jdbc:oracle:thin:@db201912101106_low?TNS_ADMIN=/cloud/project/db201912101106",
                  username,
                  askpass::askpass("Enter your password: "))
Load event_views data over JDBC
Here’s the full ords_sample_app_event_views_jdbc.R script. It requires two libraries and if you are using RStudio either on your desktop or in posit Cloud they, and their dependencies will be imported.
# ------------------------------------------------------------------------------
# File:        ords_sample_app_event_views_jdbc.R
# Description: This script performs data analysis on the ORDS Sample Application
#              events dataset to generate summary statistics and visualizations.
#              Data is loaded from source DB using JDBC.
#
#              JDBC Connection Requires:
#               - JDBC Jars
#               - Autonomous DB Wallet Archive
#
# Author:      https://peterobrien.blog/
# Date:        2024-10-17
# Version:     1.0
# ------------------------------------------------------------------------------
#
# Notes:
# - Requires the packages: askpass,rjdbc
# - Data source: events_view from the ORDS Sample Application database.
# - Authentication: JDBC authentication with prompt for password.
# Load the necessary packages
library(askpass)
library(RJDBC)
# Specify the path to the JDBC driver
jdbc_driver <- JDBC(driverClass = "oracle.jdbc.OracleDriver",
                    classPath = "/cloud/project/ojdbc11-23.5.0.24.07.jar:/cloud/project/oraclepki-23.5.0.24.07.jar")  # Replace with your path
# Use database username for your ORDS Sample Application.
username <- "ords_sample_app"
# Establish the connection
# Replace TNS Name and wallet location with your actual values
conn <- dbConnect(jdbc_driver,
                  "jdbc:oracle:thin:@db201912101106_low?TNS_ADMIN=/cloud/project/db201912101106",
                  username,
                  askpass::askpass("Enter your password: "))
# Check the connection
if (!is.null(conn)) {
  print("Connection successful!")
  data <- dbGetQuery(conn, "SELECT * FROM events_view")
  dbDisconnect(conn)

  # Display the first few rows of the data
  head(data)

  # Summarise the data to count occurrences of each CITY_NAME
  city_counts <- table(data$CITY_NAME)

  # Create the pie chart
  pie(city_counts,
      main = "Distribution of Events by City",
      col = rainbow(length(city_counts)),
      labels = paste(names(city_counts), "(", city_counts, ")", sep=""))
}
If you leave all the comments out, that is essentially 12 lines of R code to load the data and create both a summary and a pie chart. Set the username variable to the database username for your ORDS Sample Application.
Pros
- Simple, uncomplicated code
- Very flexible – You can write any query you like
- The JDBC driver is fast and efficient
Cons
- Dependencies such as jars and wallets have to be obtained
- Too flexible – You can write any data manipulation statement to change the data
- Relying on sharing database username and password
- Using a wrong password will lock the account
REST Enabled SQL Export
Export is a little known aspect of the ORDS REST Enabled SQL service that can save files as CSV, JSON, XML and TEXT. The httr package is used to make the POST request, the jsonlite package looks after the JSON formatting and rio is for loading the data.
Load event_views data over REST Enabled SQL Export
Here’s the full ords_sample_app_event_views_rese.R script. It requires more libraries than the JDBC script but again, if you are using RStudio either on your desktop or in posit Cloud they, and their dependencies will be imported.
# ------------------------------------------------------------------------------
# File:        ords_sample_app_event_views_rese.R
# Description: This script performs data analysis on the ORDS Sample Application
#              events dataset to generate summary statistics and visualizations.
#              Data is exported using Oracle REST Data Services feature:
#              REST Enabled SQL Export
#
#              Export instruction comprises:
#               - SQL select statement for data from events_view
#               - Format for export file to be JSON
#
# Author:      https://peterobrien.blog/
# Date:        2024-10-17
# Version:     1.0
# ------------------------------------------------------------------------------
#
# Notes:
# - Requires the packages: askpass, httr, jsonlite, rio
# - Data source: events_view from the ORDS Sample Application database.
# - Authentication: basic authentication with prompt for password.
# Load the necessary packages
library(askpass)
library(httr)
library(jsonlite)
library(rio)
# Define the ORDS REST Enabled SQL Export URL, username, and password to use.
# Change the URL to match your server and
# use database username for your ORDS Sample Application.
username <- "ords_sample_app"
ords_concert_app_url <- paste0("https://mydatabase.adb.myregion.oraclecloudapps.com/ords/", username, "/")
export_url <- paste0(ords_concert_app_url, "_/sql/export")
# Define the export details including select statement and output format
export_instructions <- list(
  statementText = "select * from events_view",
  formatDetails = list(
    format = "JSON"
  )
)
# Format the export_instructions as a string
request_body <- list(
  data = toJSON(export_instructions, auto_unbox = TRUE)
)
# Specify the basic authentication for every HTTP request but prompt for the password at runtime
set_config(authenticate(username, askpass::askpass("Enter your password: ")));
# Define the local file path where you want to save the file
file_path <- tempfile()
# Make a POST request ot ORDS REST Enabled SQL Export
response <- POST(
  url = export_url,
  body = request_body,
  encode = "form",  # Specifies application/x-www-form-urlencoded encoding
  write_disk(file_path, overwrite = TRUE)
  )
# Check the status code to ensure the request was successful
if (status_code(response) == 200) {
  message("File successfully downloaded to: ", file_path)
} else {
  stop("Failed to download file. Status code: ", status_code(api_response))
}
# Import the downloaded file into R
data <- import(file_path, "json")
# Display the first few rows of the data
head(data)
# Create a frequency table for the city_name column
city_counts <- table(data$city_name)
# Create the pie chart
pie(city_counts,
    main = "Distribution of events across Cities",
    col = rainbow(length(city_counts)),
    labels = paste(names(city_counts), ":", city_counts))
Although we no longer have the overhead of setting up JDBC jars and a wallet file this R script is much more complicated. We’re now at about 25 lines of R code to use the ORDS REST Enabled SQL Export service to run a query and save the output as a JSON file which we then use rio package to load. Remember, if you are going to run this script in your environment you must set the database username for your ORDS Sample Application.
Pros
- No additional setup such as JARS or Wallet
- Very flexible – You can write any query you like
Cons
- Too flexible – You can write any data manipulation statement to change the data
- Relying on sharing username and password
- Using a wrong password will lock the account
Secured REST Enabled view
Also referred to as AutoREST, this feature in Oracle REST Data Services (ORDS) makes it incredibly easy to expose database objects as RESTful web services. With AutoREST, tables, views, and PL/SQL packages in your Oracle Database can be instantly accessible via REST APIs without writing any additional code. Moreover, these services can be secured, requiring authorisation to access. See Developing Oracle REST Data Services Applications and ORDS.ENABLE_OBJECT for details but the step is as simple as:
BEGIN
    ORDS.ENABLE_OBJECT(
        P_ENABLED      => TRUE,
        P_SCHEMA      => 'ORDS_CONCERT_APP',
        P_OBJECT      =>  'EVENTS_VIEW',
        P_OBJECT_TYPE      => 'VIEW',
        P_OBJECT_ALIAS      => 'events_view',
        P_AUTO_REST_AUTH      => TRUE
    );
    COMMIT;
END;
Now let’s define an OAuth 2.0 client with the relevant privilege and role to access this service:
BEGIN
    ORDS_METADATA.OAUTH.CREATE_CLIENT(
        P_NAME             => 'RStudio',
        P_GRANT_TYPE => 'client_credentials',
        P_OWNER => 'ORDS_CONCERT_APP',
        P_DESCRIPTION => 'Used for R programming language',
        P_ORIGINS_ALLOWED => '',
        P_REDIRECT_URI => '',
        P_SUPPORT_EMAIL => 'rstudio@ords-examples.com',
        P_SUPPORT_URI => '',
        P_PRIVILEGE_NAMES => 'oracle.dbtools.autorest.privilege.ORDS_CONCERT_APP.EVENTS_VIEW'
    );
    ORDS_METADATA.OAUTH.GRANT_CLIENT_ROLE(
        P_CLIENT_NAME => 'RStudio',
        P_ROLE_NAME => 'oracle.dbtools.role.autorest.ORDS_CONCERT_APP.EVENTS_VIEW'
    );
    COMMIT;
END;
Get the CLIENT_ID and CLIENT_SECRET for the client just created.
SELECT
    CLIENT_ID,
    CLIENT_SECRET
FROM
    USER_ORDS_CLIENTS
WHERE
    NAME = 'RStudio';
That’s the value that we’ll use in the R script to get an access token every time the script is executed.
# Define base URL for all requests
username <- "ords_concert_app"
ords_concert_app_url <- paste0("https://c4tozyxuw8nq2ja-db201912101106.adb.eu-frankfurt-1.oraclecloudapps.com/ords/", username, "/")
# Define your OAuth 2.0 credentials and token endpoint
client_id <- "139ZODb9nig15blwlSlUNQ.."
client_secret <- "DAIdfS8C5Wg2nN9SGxwCfQ.."
token_url <- paste0(ords_concert_app_url, "oauth/token")
# Make the request to get the access token
response <- POST(
  url = token_url,
  authenticate(client_id, client_secret),
  encode = "form",
  body = list(
    grant_type = "client_credentials"
  )
)
# Parse the response to extract the access token
token_data <- content(response, as = "parsed", type = "application/json")
access_token <- token_data$access_token
The access_token variable can be used as the bearer token for any requests to the REST service. By default, it will expire in 1 hour after it is issued.
The other interesting part of this script is handling the paginated response from the REST Enabled view which contains information on how to make subsequent requests until all the data is retrieved. Here’s an example of the response structure:
{
  "items": [
... removed for brevity ...
   ],
  "hasMore":true,
  "limit":25,
  "offset":0,
  "count":25,
  "links":[
    {
"rel":"self",
"href":"https://myadb.com/ords/ords_concert_app/events_view/"
    },
    {
"rel":"first",
"href":"https://myadb.com/ords/ords_concert_app/events_view/"
    },
    {
"rel":"next",
"href":"myadb.com/ords/ords_concert_app/events_view/?offset=25"
    }
  ]
}
The R script will loop through the data in blocks. By default the pagination is 25 rows but we can make that 100 rows at a time:
base_url <- paste0(ords_concert_app_url, "events_view/?limit=100")
all_items <- list()
# Function to fetch data from the API using the next link
fetch_paginated_data <- function(url) {
  # Display the GET request URL
  print(paste("GET ", url))
  response <- GET(url, add_headers(Authorization = paste("Bearer", access_token)))
  data <- content(response, as = "parsed", type = "application/json")
  return(data)
}
# Start the loop to fetch all paginated data
next_url <- base_url
repeat {
  # Fetch the data from the current page
  data <- fetch_paginated_data(next_url)

  # Append the items from the current page to the list of all items
  all_items <- c(all_items, data$items)

  # Check if there's a "next" link in the response
  next_link <- NULL
  for (link in data$links) {
    if (link$rel == "next") {
      next_link <- link$href
      break
    }
  }

  # Exit the loop if there's no more data to fetch
  if (is.null(next_link) || !data$hasMore) {
    break
  } else {
    next_url <- next_link
  }
}
# Convert the list of all items into a data frame
data <- do.call(rbind, lapply(all_items, as.data.frame))
Of course 100 records at a time is not all that efficient but I have it set here so that you can see at least two requests.
Load event_views data using secured REST Enabled view
Here’s the full ords_sample_app_event_views_oauth.R script. It requires less libraries than the REST Enabled SQL Export script because it doesn’t involve exporting the data to a temporary file and then loading it. More importantly though, OAuth 2.0 Client Credential flow is used rather than database username and passwords.
# ------------------------------------------------------------------------------
# File: ords_sample_app_event_views_oauth.R
# Description: This script performs data analysis on the ORDS Sample Application
# events dataset to generate summary statistics and visualizations.
# Data is exported using Oracle REST Data Services features:
# - Protected REST Enabled object ( events_view in this case)
# - OAuth Client Credentials
#
# Author: https://peterobrien.blog/
# Date: 2024-10-17
# Version: 1.0
# ------------------------------------------------------------------------------
#
# Notes:
# - Requires the packages: httr, jsonlite
# - Data source: events_view from the ORDS Sample Application database.
# - Authentication: oauth 2.0 client credentials flow
library(httr)
library(jsonlite)
# Define base URL for all requests
username <- "ords_concert_app"
ords_concert_app_url <- paste0("https://c4tozyxuw8nq2ja-db201912101106.adb.eu-frankfurt-1.oraclecloudapps.com/ords/", username, "/")
# Define your OAuth 2.0 credentials and token endpoint
client_id <- "139ZODb9nig15blwlSlUNQ.."
client_secret <- "DAIdfS8C5Wg2nN9SGxwCfQ.."
token_url <- paste0(ords_concert_app_url, "oauth/token")
# Make the request to get the access token
response <- POST(
url = token_url,
authenticate(client_id, client_secret),
encode = "form",
body = list(
grant_type = "client_credentials"
)
)
# Parse the response to extract the access token
token_data <- content(response, as = "parsed", type = "application/json")
access_token <- token_data$access_token
# Display the access token
print(access_token)
# Initialize the base URL for the API and a list to store all items
# Requesting 100 records at a time
base_url <- paste0(ords_concert_app_url, "events_view/?limit=100")
all_items <- list()
# Function to fetch data from the API using the next link
fetch_paginated_data <- function(url) {
# Display the GET request URL
print(paste("GET", url))
response <- GET(url, add_headers(Authorization = paste("Bearer", access_token)))
content_data <- content(response, as = "parsed", type = "application/json")
return(content_data)
}
# Start the loop to fetch all paginated data
next_url <- base_url
repeat {
# Fetch the data from the current page
paginated_data <- fetch_paginated_data(next_url)
# Append the items from the current page to the list of all items
all_items <- c(all_items, paginated_data$items)
# Check if there's a "next" link in the response
next_link <- NULL
for (link in paginated_data$links) {
if (link$rel == "next") {
next_link <- link$href
break
}
}
# Exit the loop if there's no more data to fetch
if (is.null(next_link) || !paginated_data$hasMore) {
break
} else {
next_url <- next_link
}
}
# Convert the list of all items into a data frame
data <- do.call(rbind, lapply(all_items, as.data.frame))
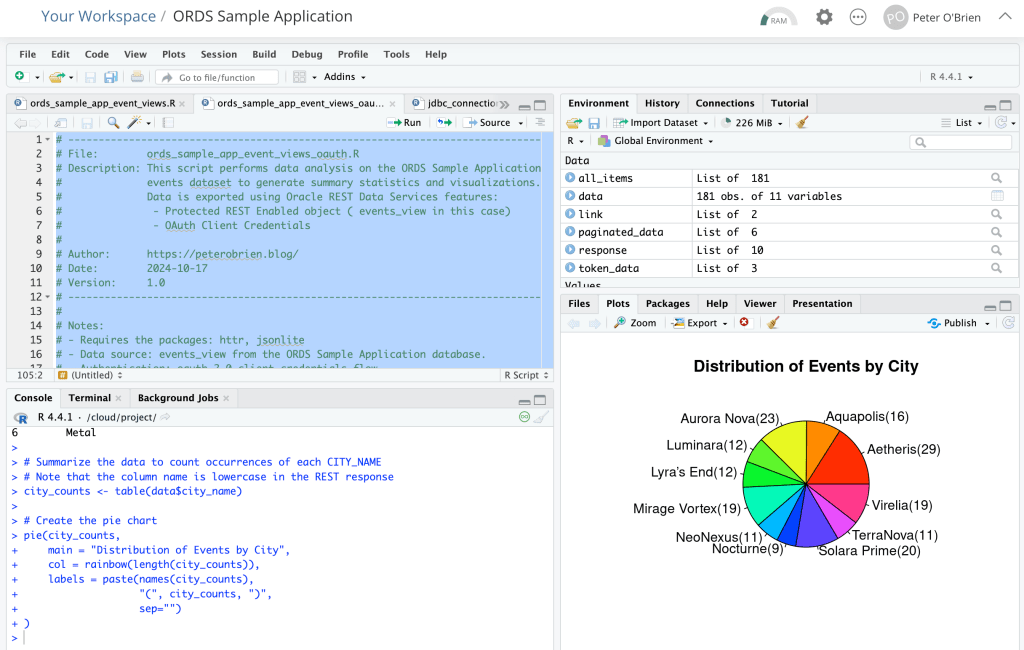
# Display the first few rows of the combined data
head(data)
# Summarize the data to count occurrences of each CITY_NAME
# Note that the column name is lowercase in the REST response
city_counts <- table(data$city_name)
# Create the pie chart
pie(city_counts,
main = "Distribution of Events by City",
col = rainbow(length(city_counts)),
labels = paste(names(city_counts),
"(", city_counts, ")",
sep="")
)
Leaving out the comments we’re now looking at about 50 lines to code to
- Get the access token
- Retrieve the data over REST calls
- Output the summary and generate the pie chart
Unlike the other scripts, you should be able to run this “as is” in your R environment even if you do not have your own ORDS Sample Application because the CLIENT_ID, CLIENT_SECRET and URLs are valid. At the time of writing anyway 😀
Pros
- No additional setup such as JARS or Wallet
- Creating a secured service for accessing the specific view is really easy
- No exposure of database username and password
- OAuth client access can be revoked at any time
- Read only view so no risk of manipulation of data
Cons
- Not as flexible as being able to run any query one wants from R
- More complicated code to get the access_token AND loop through the paginated responses
Further Reading and Resources
For a deeper understanding of how to utilise ORDS in a modern application context, I recommend checking out Jeff Smith’s article on the ORDS Sample Application. Jeff’s blog is immensely valuable providing insightful tips and a practical approach to building REST APIs effectively.
Conclusion
Integrating R with Oracle REST Data Services provides a powerful toolset for retrieving and analysing data. In this article I detailed three options:
- JDBC
- REST Enabled SQL Export
- REST Services ( AutoREST )
By following the steps outlined in this post, you can set up your R environment to interact with ORDS seamlessly. This integration opens up a wealth of possibilities for data analysis and application development.
Feel free to share your thoughts or questions in the comments below!

One thought on “🎉 Data Science in Concert: Inspect Data from the ORDS Sample Application with R!”